Fig. 5.
Download original image
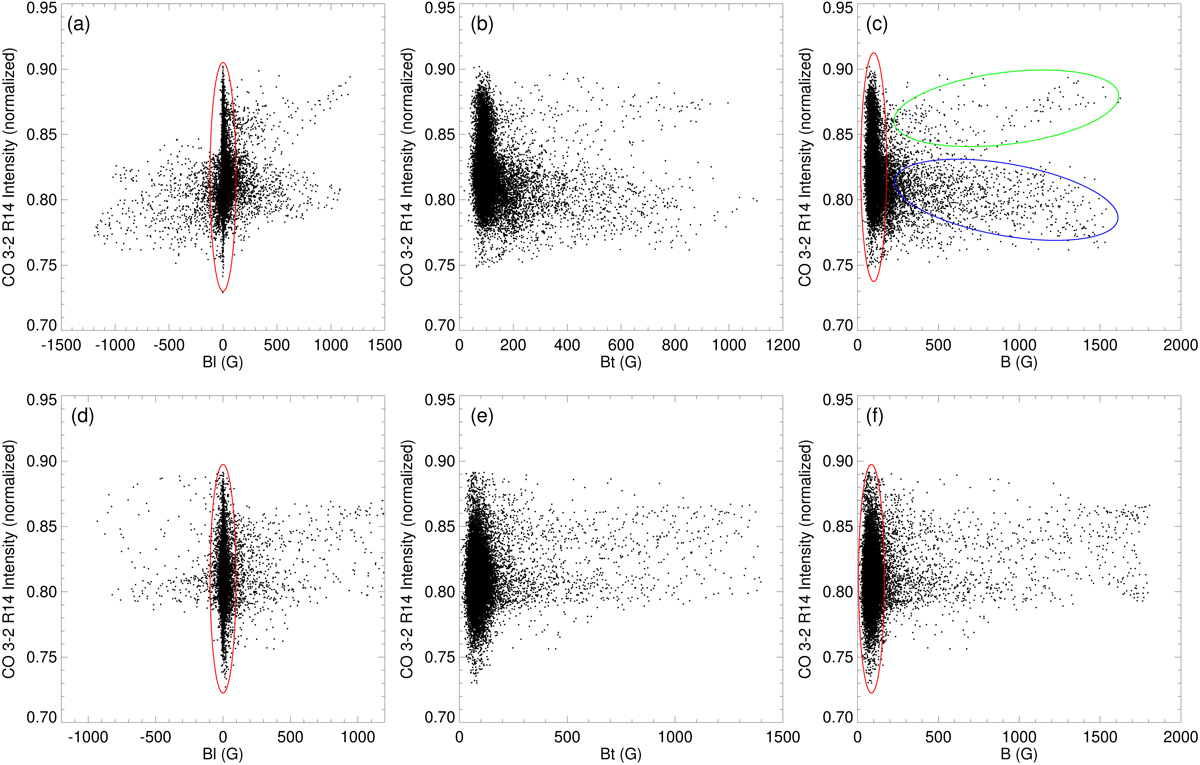
Scatter plots showing the relationships between the normalized CO 3–2 R14 line center intensity (I3-2 R14/Icontinuum) and the line-of-sight magnetic field (Bl), the horizontal magnetic field (Bt), and the total magnetic field strength (B). The top panels (a–c) and bottom panels (d–f) are for September 8 and 11, 2018. The red ellipses indicate the QS regions where the CO 3-2 R14 line center intensity changes in an extensive range. The green ellipse in panel c shows that the CO 3–2 R14 line center intensity is brighter when the magnetic field strength is stronger. The blue ellipse reveals the opposite relationship, which means the CO 3–2 R14 line center intensity is inversely proportional to the magnetic field strength.
Current usage metrics show cumulative count of Article Views (full-text article views including HTML views, PDF and ePub downloads, according to the available data) and Abstracts Views on Vision4Press platform.
Data correspond to usage on the plateform after 2015. The current usage metrics is available 48-96 hours after online publication and is updated daily on week days.
Initial download of the metrics may take a while.