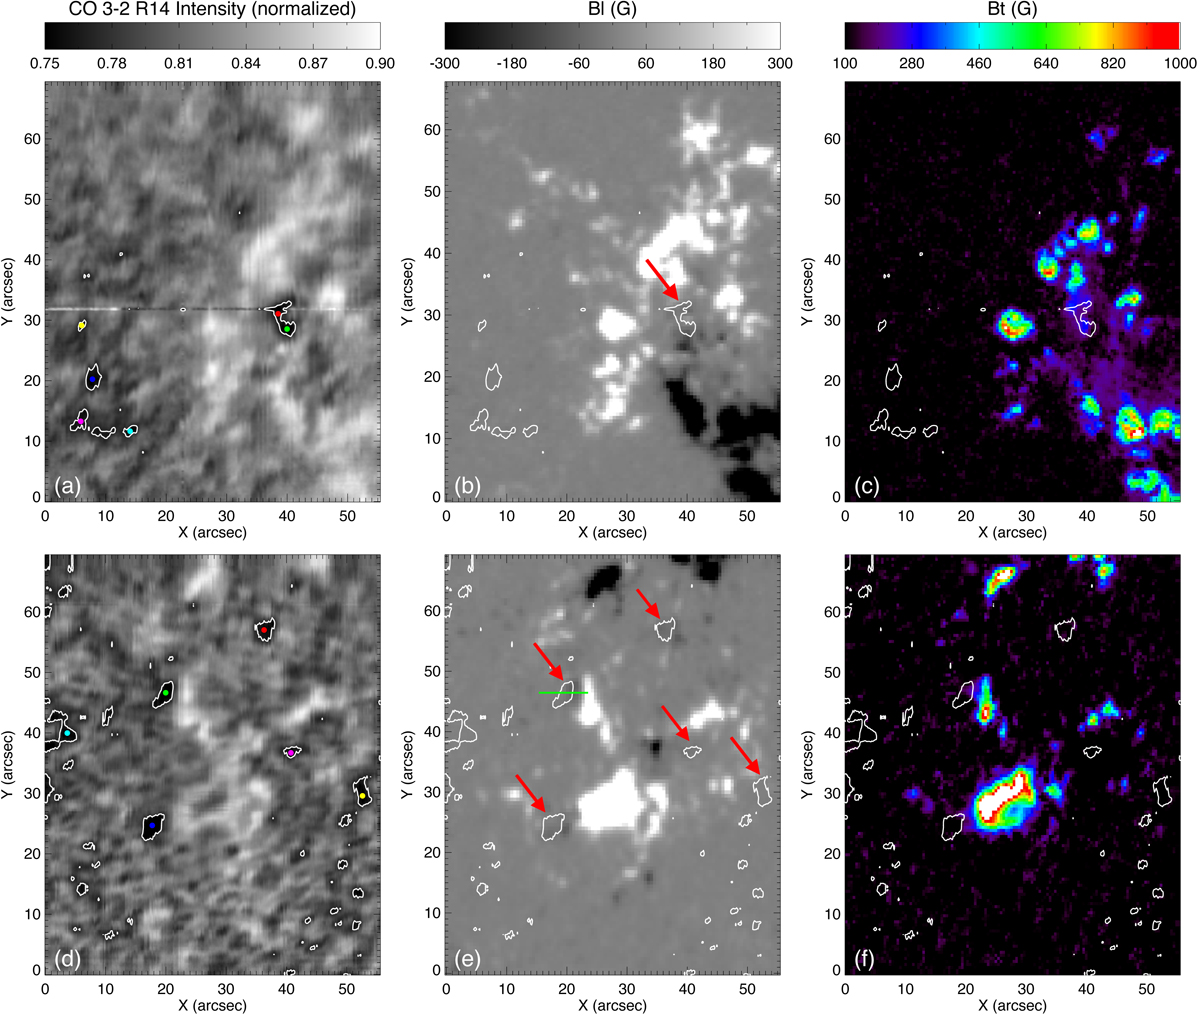
Fig. 3.
Download original image
Normalized CO 3-2 R14 line center intensity images, HMI line-of-sight magnetograms, and horizontal magnetic field. The top (a–c) and bottom (d–f) panels are for September 8 and 11, 2018, respectively. The white contours indicate the dark regions (cold bubbles) in the normalized CO 3–2 R14 line center intensity map with a level of I3-2 R14/Icontinuum = 0.77. The red arrows indicate the cold bubbles near or surrounded by magnetic fields. The colored dots in panels a and d give the positions where we show the normalized CO spectral lines in Figs. 4a,b. The green line in panel e is the slit on which we show the changes of the CO 3–2 R14 line center intensity and Bl strength in Fig. 8a.
Current usage metrics show cumulative count of Article Views (full-text article views including HTML views, PDF and ePub downloads, according to the available data) and Abstracts Views on Vision4Press platform.
Data correspond to usage on the plateform after 2015. The current usage metrics is available 48-96 hours after online publication and is updated daily on week days.
Initial download of the metrics may take a while.