Fig. 7
Download original image
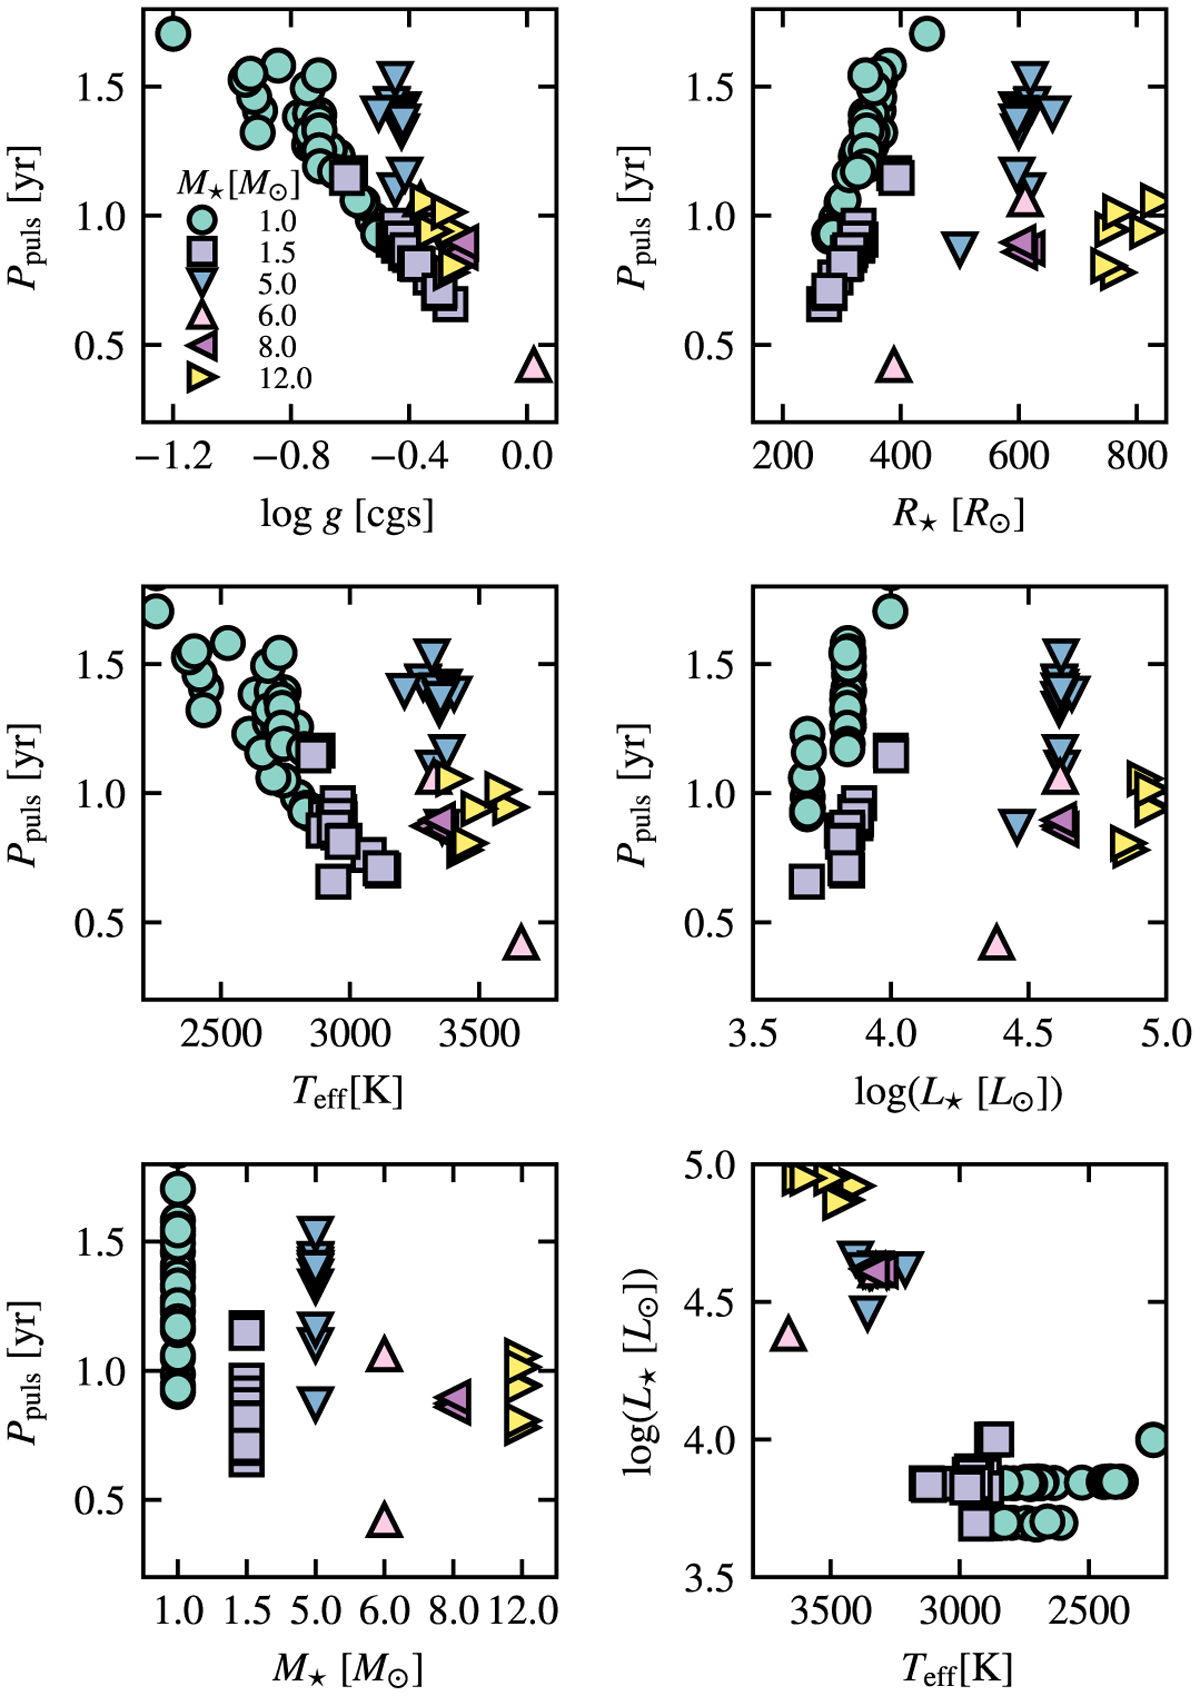
Derived pulsation periods plotted against selected stellar parameters of the models. Five panels show the pulsation period against (top to bottom reading left to right): surface gravity; stellar radius; averaged effective temperature; stellar luminosity and stellar mass. The last panel illustrates how the models in this work fit into the H-R diagram.
Current usage metrics show cumulative count of Article Views (full-text article views including HTML views, PDF and ePub downloads, according to the available data) and Abstracts Views on Vision4Press platform.
Data correspond to usage on the plateform after 2015. The current usage metrics is available 48-96 hours after online publication and is updated daily on week days.
Initial download of the metrics may take a while.