Fig. 6
Download original image
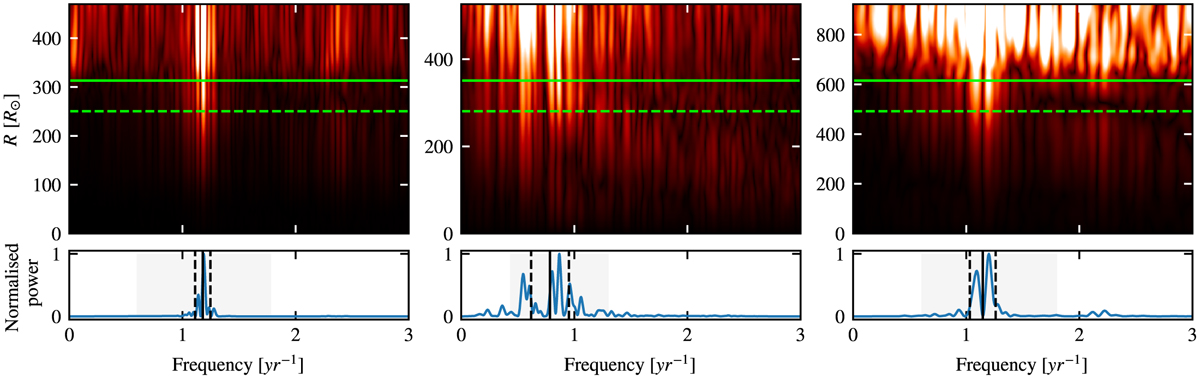
FFT spectra of the representative 1.5 M⊙, 1 M⊙, and 8 M⊙ models shown in Fig. 5 (st28gm05n023, st28gm06n039, and st34gm02n001) respectively. The FFT power spectra are presented as a function of radial coordinates and frequency (scaled to show the maximum power in between 80–100% of the radius), and with the signal averaged and normalised between the thin layer beneath the stellar radius.
Current usage metrics show cumulative count of Article Views (full-text article views including HTML views, PDF and ePub downloads, according to the available data) and Abstracts Views on Vision4Press platform.
Data correspond to usage on the plateform after 2015. The current usage metrics is available 48-96 hours after online publication and is updated daily on week days.
Initial download of the metrics may take a while.