Fig. 5
Download original image
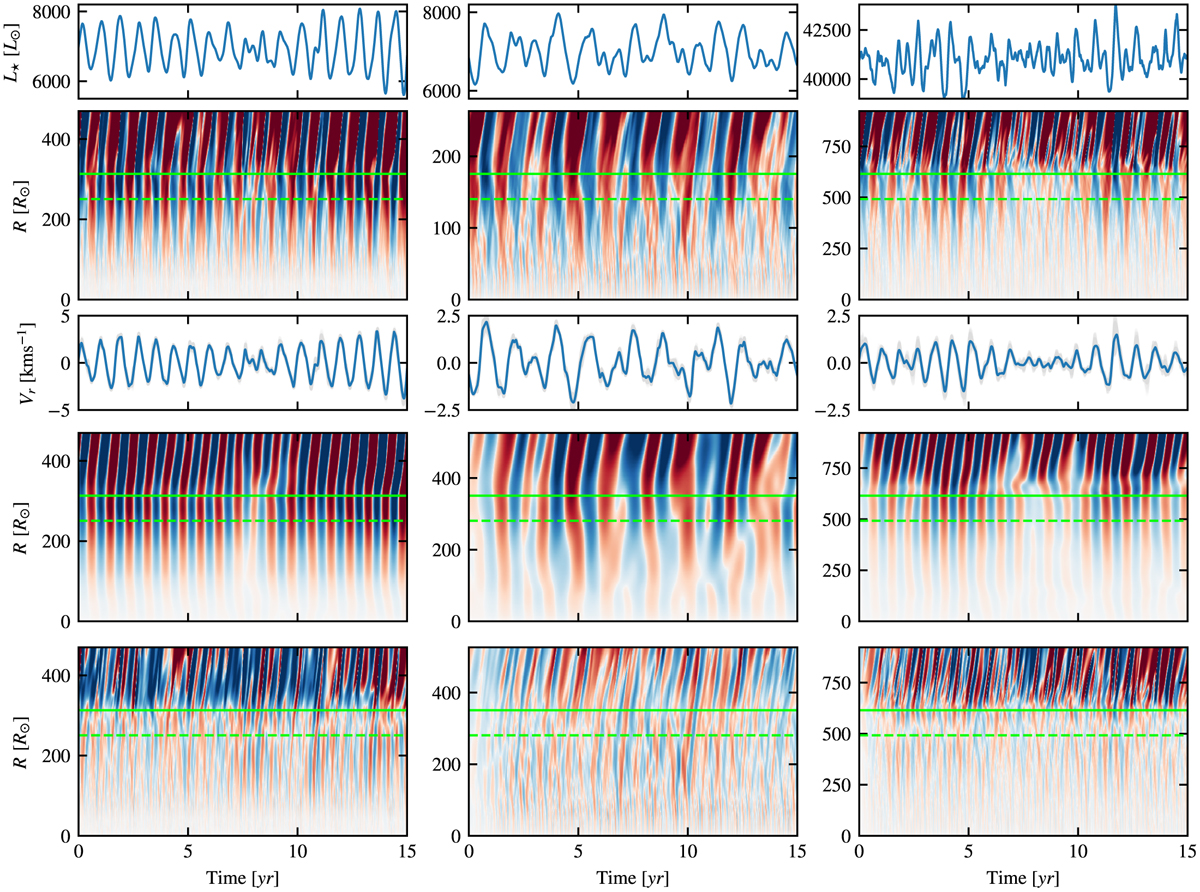
Pulsation properties of three representative models. Columns from left to right are outputs of selected 1.5 M⊙, 1 M⊙, and 8 M⊙ models (st28gm05n023, st28gm06n039, and st34gm02n001). The rows, from top to bottom (all showing 15 yr of simulated time): bolometric luminosity; spherically averaged radial velocity; its average in a thin layer beneath the stellar radius; recovered velocity field after masking for the pulsation signal; recovered velocity field after removing the pulsation signal. The solid and dashed lines respectively mark the radius and 80% of the radius of the star. The limits on the colour scales in the second, fourth, and fifth rows are around ±8, ±4, and ±2 [km s−1], respectively, with the colour bars corresponding to the one shown in the top left panel of Fig. 2.
Current usage metrics show cumulative count of Article Views (full-text article views including HTML views, PDF and ePub downloads, according to the available data) and Abstracts Views on Vision4Press platform.
Data correspond to usage on the plateform after 2015. The current usage metrics is available 48-96 hours after online publication and is updated daily on week days.
Initial download of the metrics may take a while.