Fig. 3
Download original image
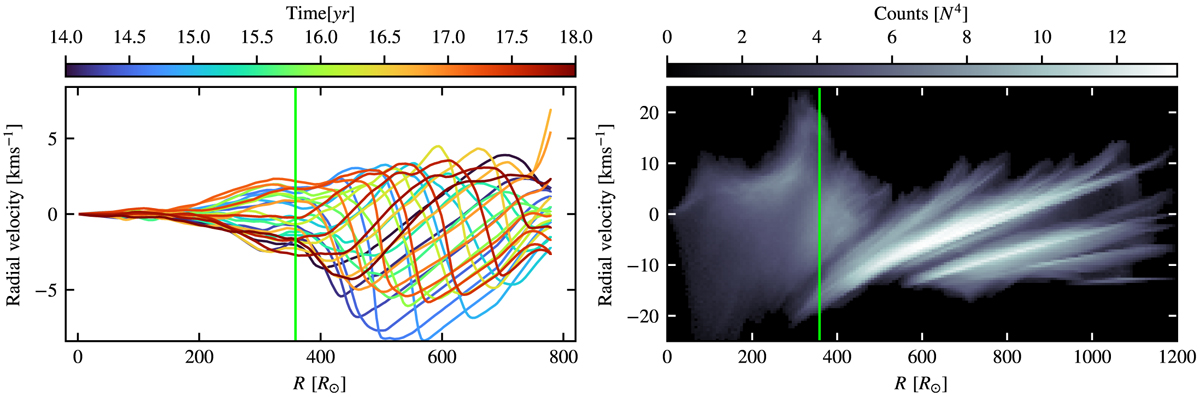
Radial velocity profiles for the standard model st26gm07n001. Left: snapshots of the spherically averaged radial velocity as a function of the radial distance, covering 4 yr of simulated time (about three pulsation cycles). Right: radial velocity computed at each cell of the computational box determined from a snapshot at time t = 14.2 [yr], presented to show the number of points (N) having the radial velocity at a certain distance from the centre of the box. The vertical lines mark the location of the stellar radius.
Current usage metrics show cumulative count of Article Views (full-text article views including HTML views, PDF and ePub downloads, according to the available data) and Abstracts Views on Vision4Press platform.
Data correspond to usage on the plateform after 2015. The current usage metrics is available 48-96 hours after online publication and is updated daily on week days.
Initial download of the metrics may take a while.