Fig. 2
Download original image
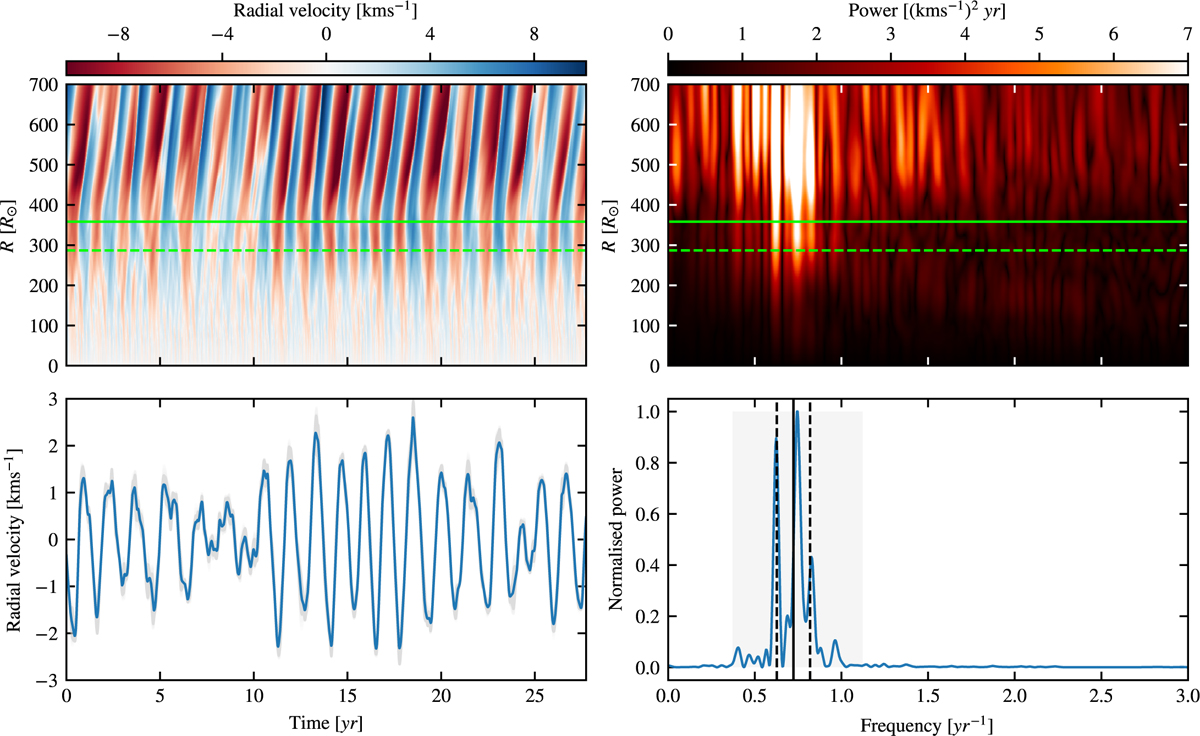
Diagnostics of the spherically averaged radial velocity for the standard model st26gm07n001. Top left: radial velocity as a function of time and radial coordinates, where the solid and dashed lines mark the radius and 80% of the radius, respectively. Bottom left: average and standard deviation of the radial velocity (in blue and shaded in grey, respectively) within the layer of 80–100% of the radius. Top right: FFT power spectrum (values are clipped to the maximum power calculated in between the 80–100% of the radius) as a function of the frequency and radial coordinates. Bottom right: averaged and normalised FFT power spectrum across the aforementioned layer. Here the shaded region is the extent over which the weighted averaging (see text) to get a characteristic pulsation frequency was done, while the solid and dashed black vertical lines indicate the computed characteristic frequency and its spread, respectively.
Current usage metrics show cumulative count of Article Views (full-text article views including HTML views, PDF and ePub downloads, according to the available data) and Abstracts Views on Vision4Press platform.
Data correspond to usage on the plateform after 2015. The current usage metrics is available 48-96 hours after online publication and is updated daily on week days.
Initial download of the metrics may take a while.