Fig. 12
Download original image
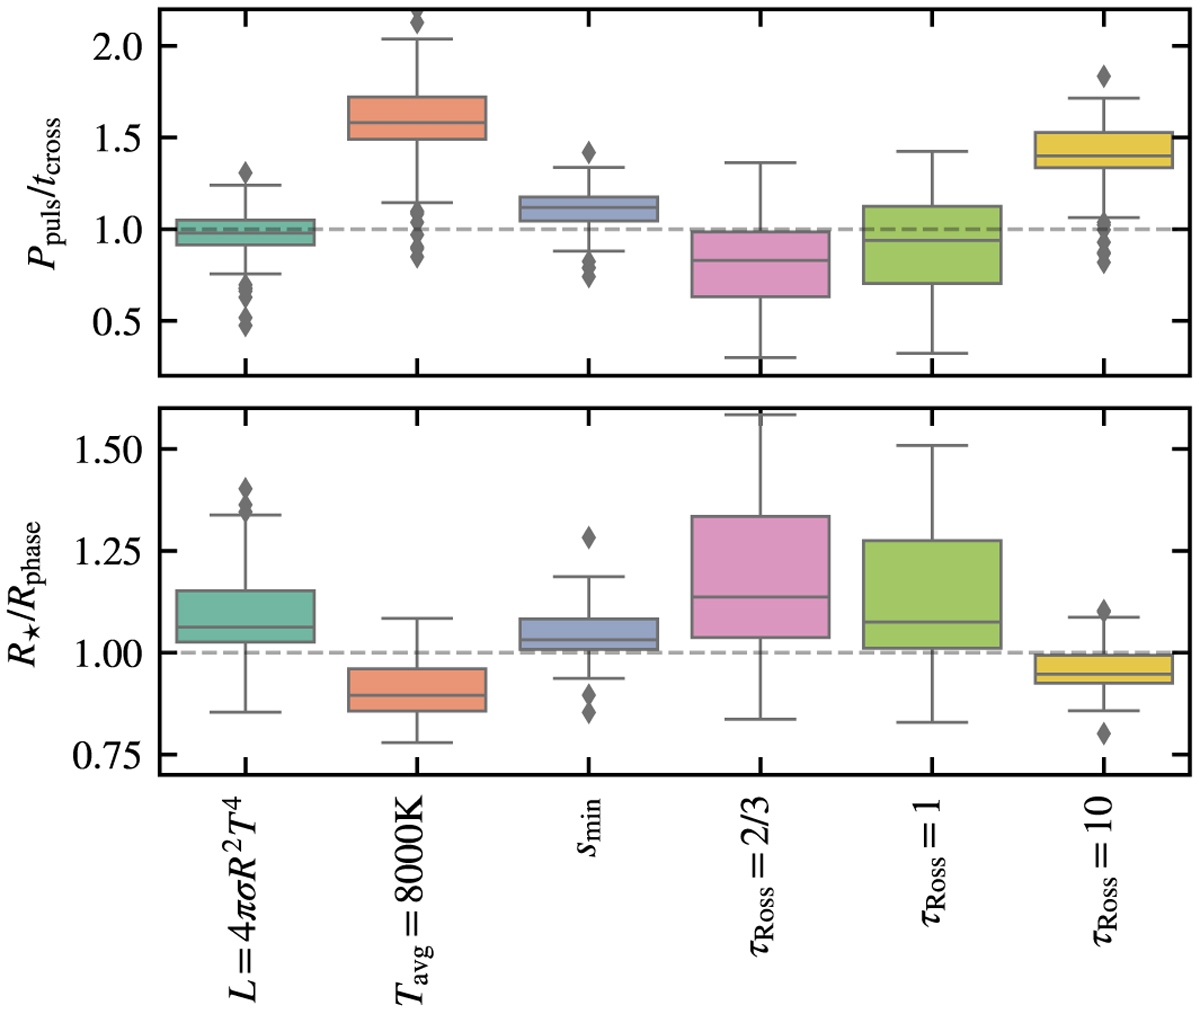
Box plots investigating the choice of stellar radius. Top panel: box plot of the ratio of the pulsation period and sound-crossing time. Bottom panel: box plot of the ratio of the stellar radius and the radius below which the layers are largely in phase. The sound-crossing times and stellar radii are from the six radii definitions tested in the models presented in this work as outlined in Sect. 2.2. Each box plot represents the distribution by drawing the box from first to third quartiles (gi and Q3, respectively) with a horizontal line drawn in between to denote the median, and the height of the box is the interquartile range (IQR). The bottom and top whiskers are bounded by bars denoting the minimum and maximum values, defined as the lowest and highest values within the range min ≥ 1.5IQR − Q1 and max ≤ 1.5IQR + Q3, respectively. Outliers are identified as values being outside of the whisker bounds, denoted by the rhombus symbols in the plot.
Current usage metrics show cumulative count of Article Views (full-text article views including HTML views, PDF and ePub downloads, according to the available data) and Abstracts Views on Vision4Press platform.
Data correspond to usage on the plateform after 2015. The current usage metrics is available 48-96 hours after online publication and is updated daily on week days.
Initial download of the metrics may take a while.