Open Access
Fig. 11
Download original image
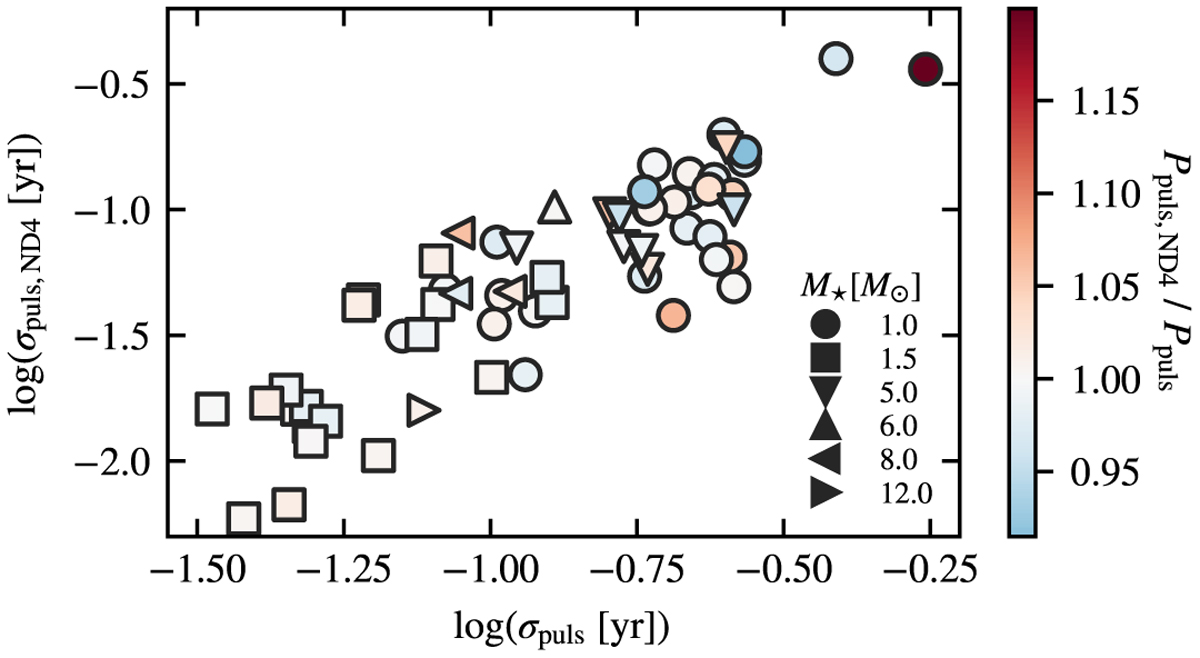
Standard deviation in the four periods calculated when the sequence was split into quarters against the spread of the period in the whole sequence. The ratio of the averaged period across the split quarters and the full sequence is coloured in. A similar plot was obtained when the full sequence was split into halves.
Current usage metrics show cumulative count of Article Views (full-text article views including HTML views, PDF and ePub downloads, according to the available data) and Abstracts Views on Vision4Press platform.
Data correspond to usage on the plateform after 2015. The current usage metrics is available 48-96 hours after online publication and is updated daily on week days.
Initial download of the metrics may take a while.