Fig. 10
Download original image
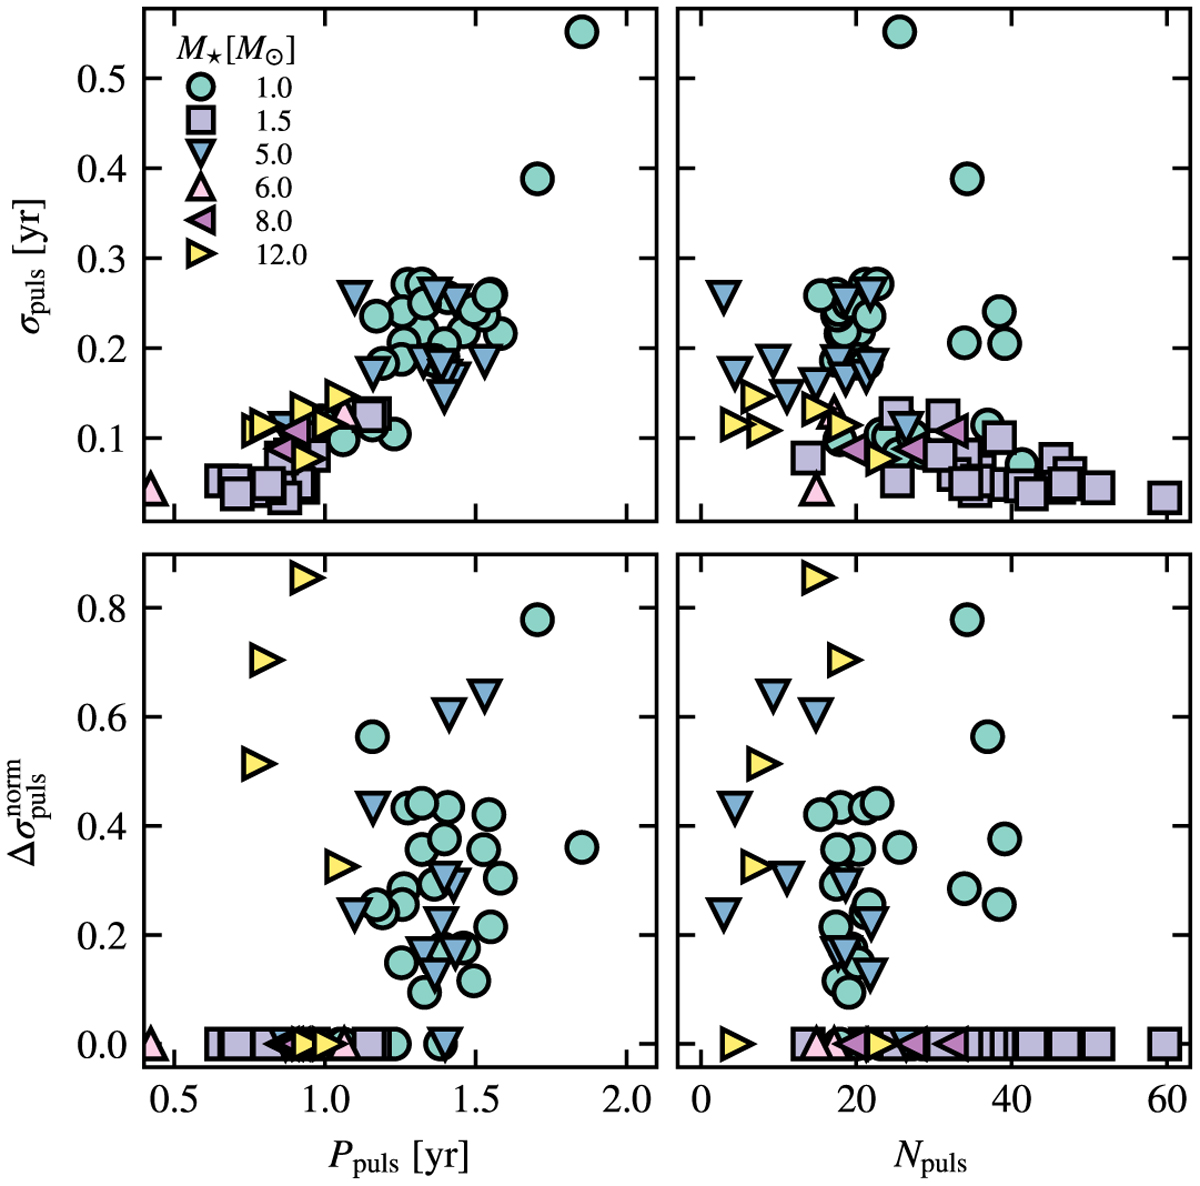
Dependence of the spread in the pulsation period on observed pulsation properties. The panels show the derived spread in the pulsation period (top row) and relative difference in the spread between using the relative or adaptive method (bottom row), against the pulsation period and the number of pulsations observed in the simulations (left and right columns, respectively).
Current usage metrics show cumulative count of Article Views (full-text article views including HTML views, PDF and ePub downloads, according to the available data) and Abstracts Views on Vision4Press platform.
Data correspond to usage on the plateform after 2015. The current usage metrics is available 48-96 hours after online publication and is updated daily on week days.
Initial download of the metrics may take a while.