Fig. 1
Download original image
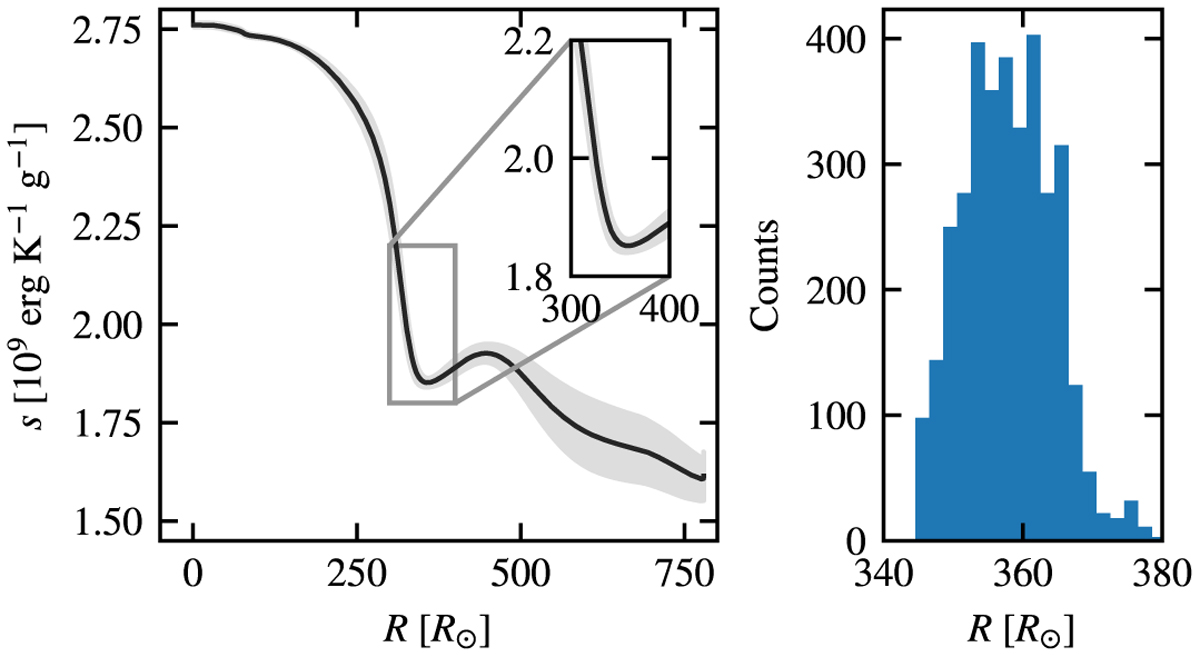
Entropy profile of the standard model st26gm07n001. Left panel: temporal mean value of the entropy as a function of the radial coordinates, with the shaded area being the corresponding standard deviation and the zoomed-in axes shows the first local entropy minimum after the first instance of a spherically averaged temperature of 8000 K away from the centre of the star. Right panel: count values of where the entropy minimum was located over a simulation (in bins of size 2 R⊙).
Current usage metrics show cumulative count of Article Views (full-text article views including HTML views, PDF and ePub downloads, according to the available data) and Abstracts Views on Vision4Press platform.
Data correspond to usage on the plateform after 2015. The current usage metrics is available 48-96 hours after online publication and is updated daily on week days.
Initial download of the metrics may take a while.