Fig. 2.
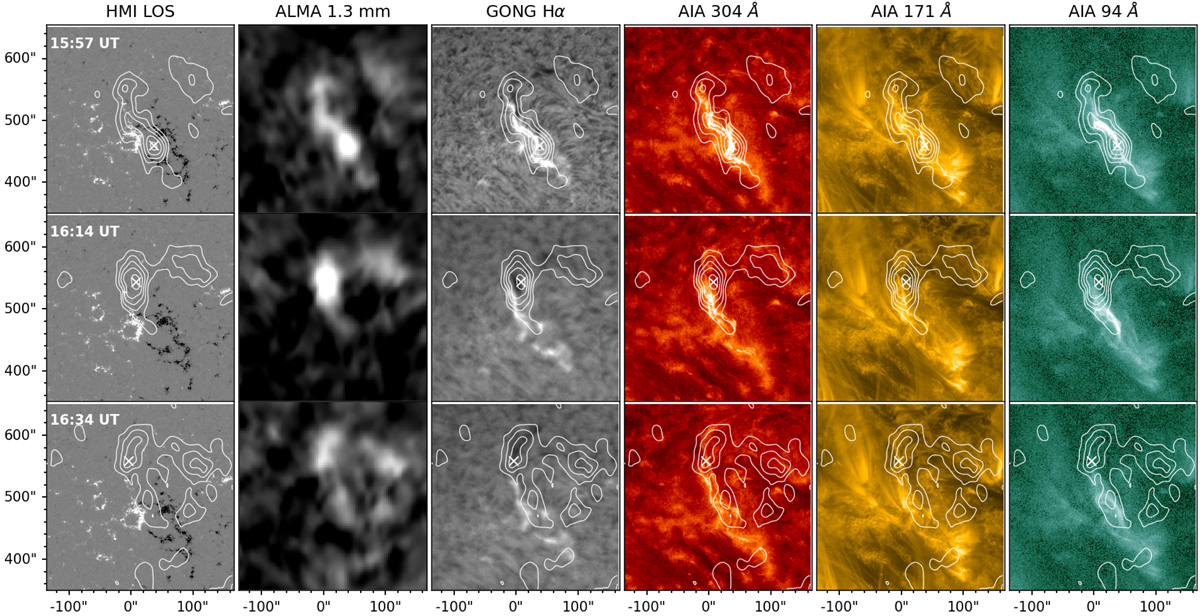
Download original image
SOL2017-04-23 flare. The ALMA images are difference images between the designated time frame and the base preflare frame. The other are regular full-scale images. ALMA contours outline five levels equidistantly within the range of 100−500 K. The peak ALMA brightness in the flaring region is marked with a white “x”. The intensity was clipped in each image to better show structures of interest.
Current usage metrics show cumulative count of Article Views (full-text article views including HTML views, PDF and ePub downloads, according to the available data) and Abstracts Views on Vision4Press platform.
Data correspond to usage on the plateform after 2015. The current usage metrics is available 48-96 hours after online publication and is updated daily on week days.
Initial download of the metrics may take a while.