Fig. 4
Download original image
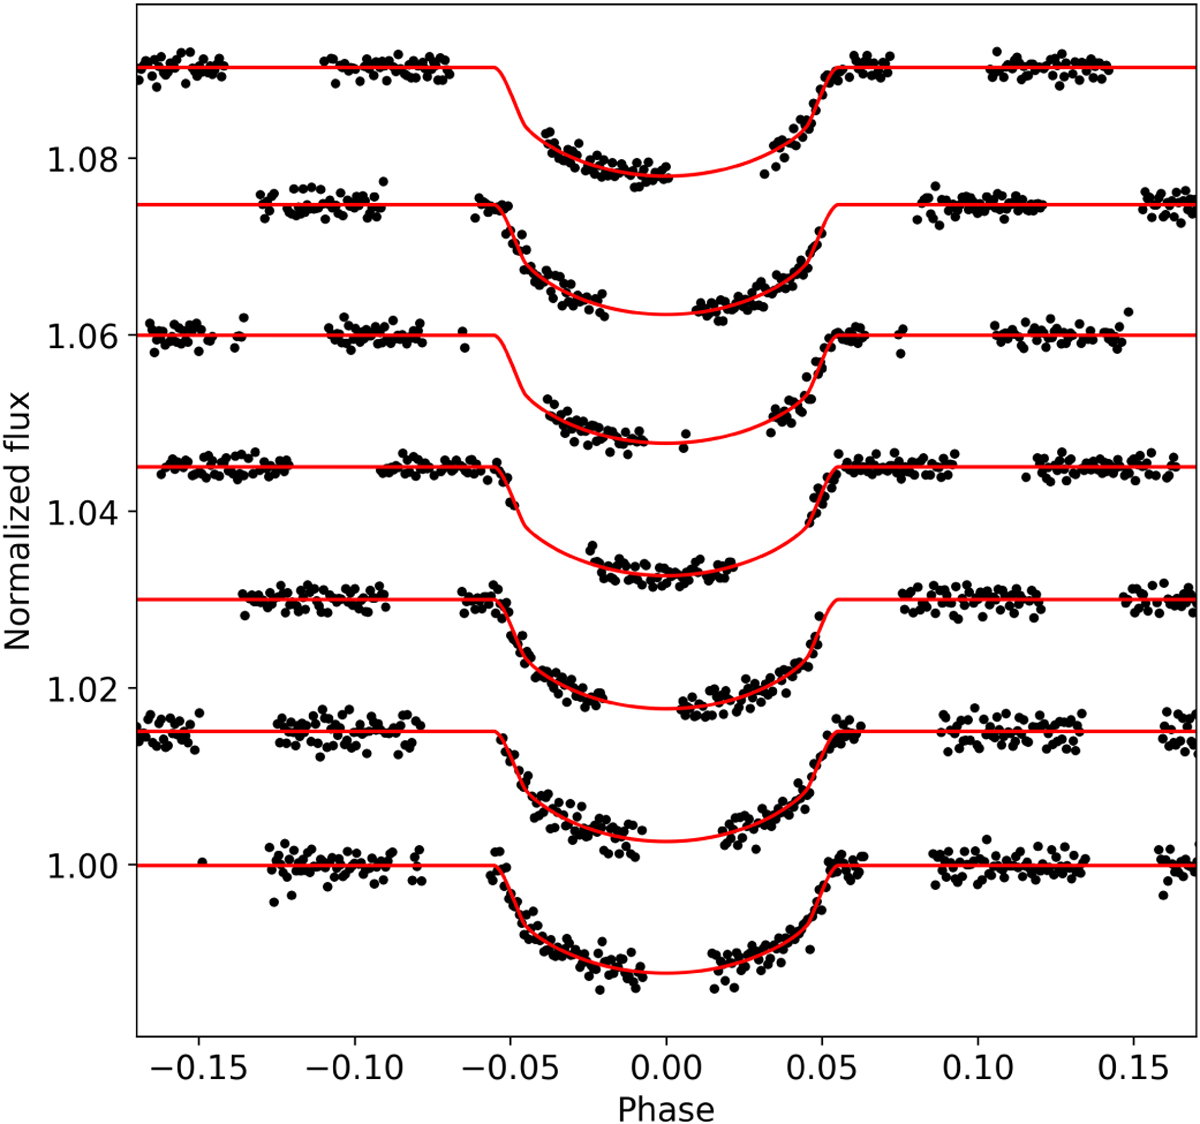
KELT-16 b transits observed with CHEOPS. The x-axis shows the orbital phase of the transits and the y-axis shows the normalised flux. There is an offset of 0.015 in terms of normalised flux between the individual transits. The data points (black dots) were corrected for the roll angle of the satellite using PYCHEOPS and fitted with TLCM. The resulting transit models are indicated by the red lines.
Current usage metrics show cumulative count of Article Views (full-text article views including HTML views, PDF and ePub downloads, according to the available data) and Abstracts Views on Vision4Press platform.
Data correspond to usage on the plateform after 2015. The current usage metrics is available 48-96 hours after online publication and is updated daily on week days.
Initial download of the metrics may take a while.