Open Access
Fig. A.1
Download original image
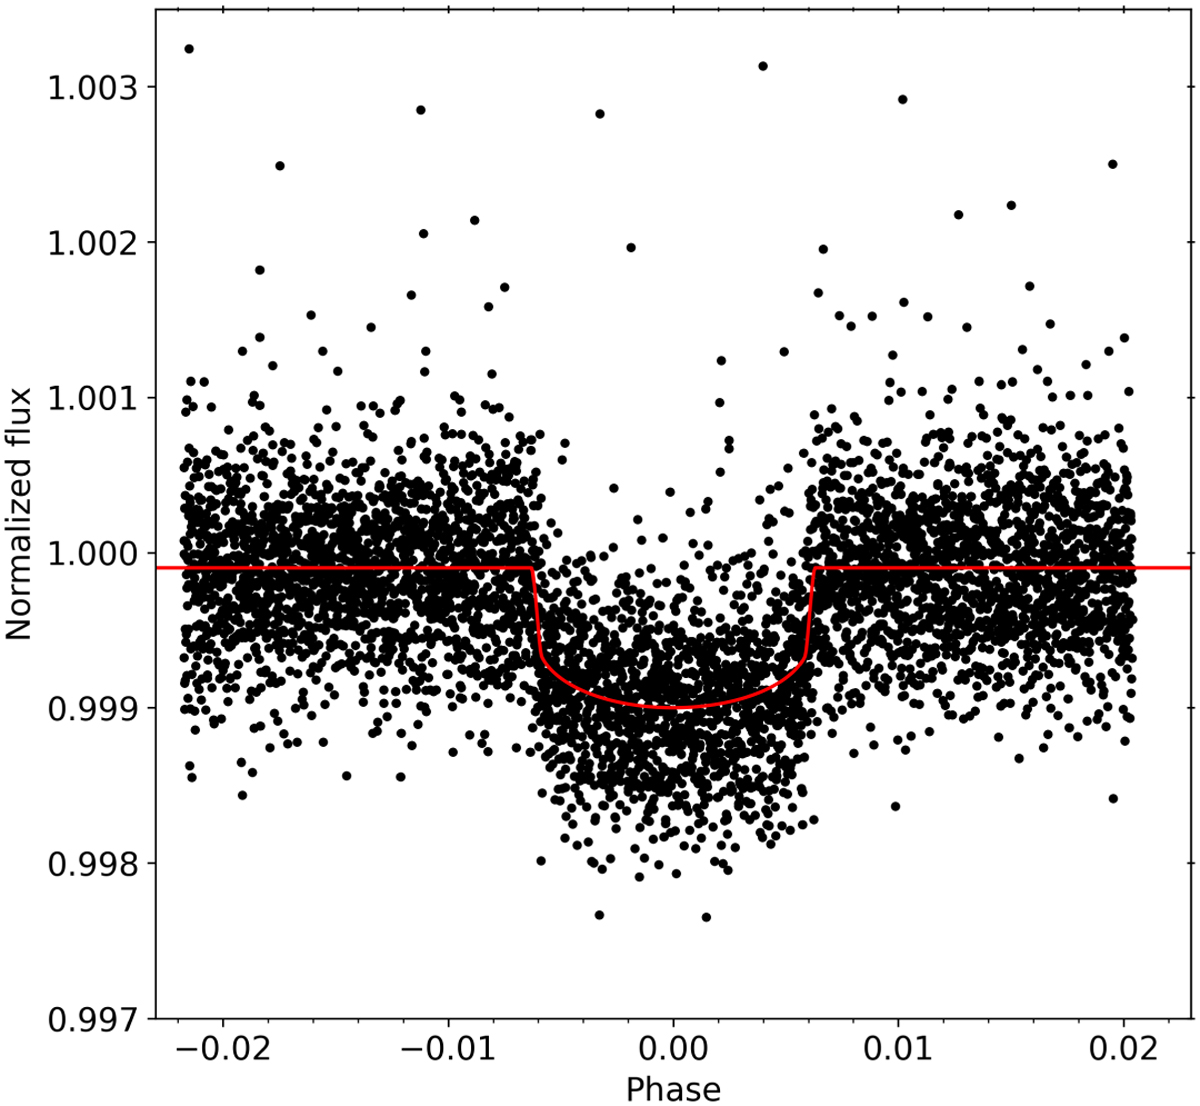
Previously unpublished phase-folded TESS transit data for HD 97658 b (black dots). The red line corresponds to the model resulting from the fits to the three available transits in the SAP flux with TLCM.
Current usage metrics show cumulative count of Article Views (full-text article views including HTML views, PDF and ePub downloads, according to the available data) and Abstracts Views on Vision4Press platform.
Data correspond to usage on the plateform after 2015. The current usage metrics is available 48-96 hours after online publication and is updated daily on week days.
Initial download of the metrics may take a while.