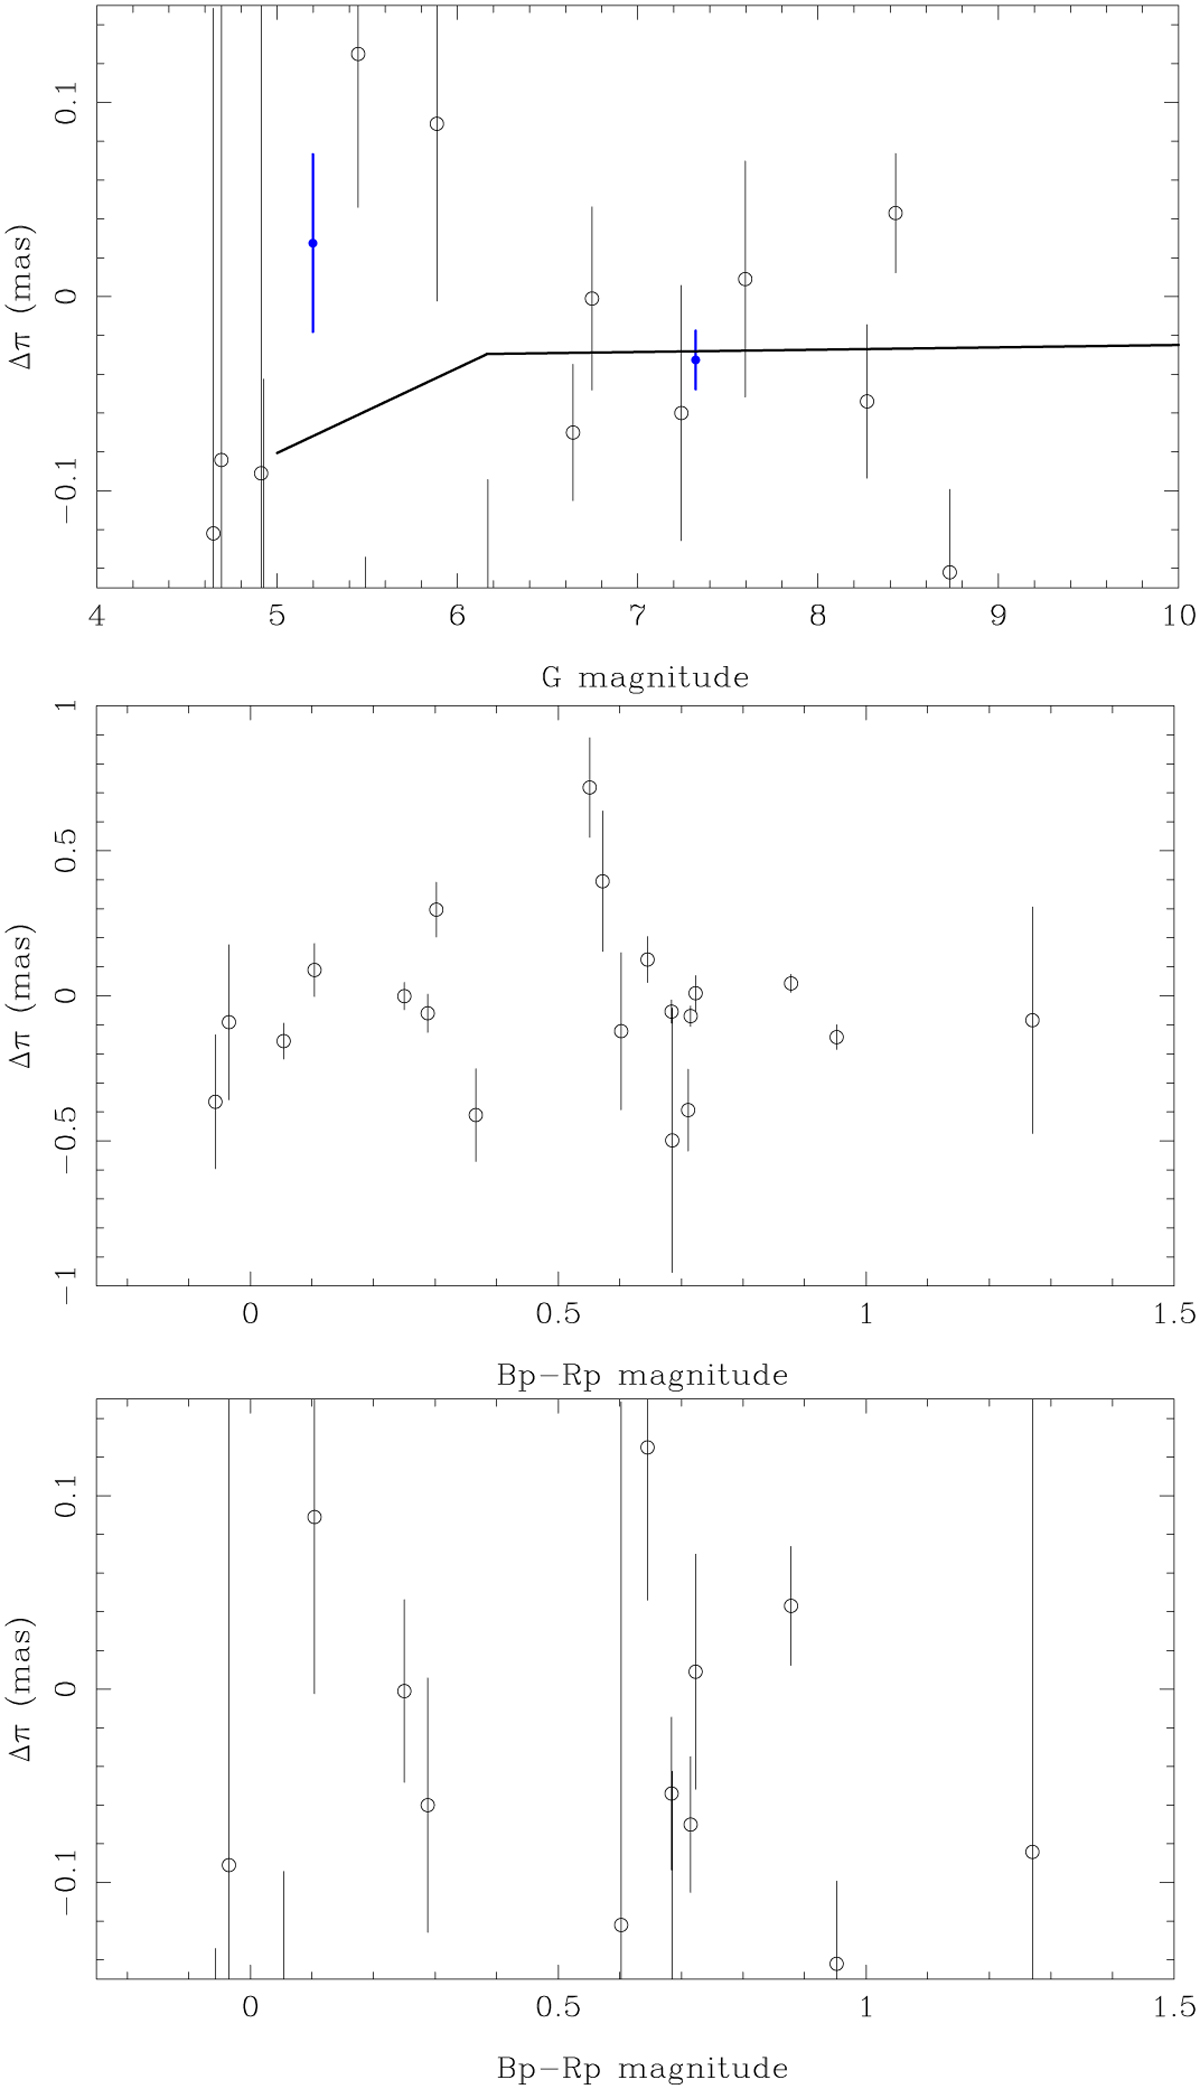
Fig. 3
Download original image
Parallax difference. Top panel: as Fig. 2 for the final selection as described in the text. There are points outside the plot range. Middle panel: offset plotted against Bp-Rp colour. The ordinate is chosen to be ±1 mas to show all data points in the sample, and the bottom panel has the same range in ordinate as in the top panel.
Current usage metrics show cumulative count of Article Views (full-text article views including HTML views, PDF and ePub downloads, according to the available data) and Abstracts Views on Vision4Press platform.
Data correspond to usage on the plateform after 2015. The current usage metrics is available 48-96 hours after online publication and is updated daily on week days.
Initial download of the metrics may take a while.