Fig. 2
Download original image
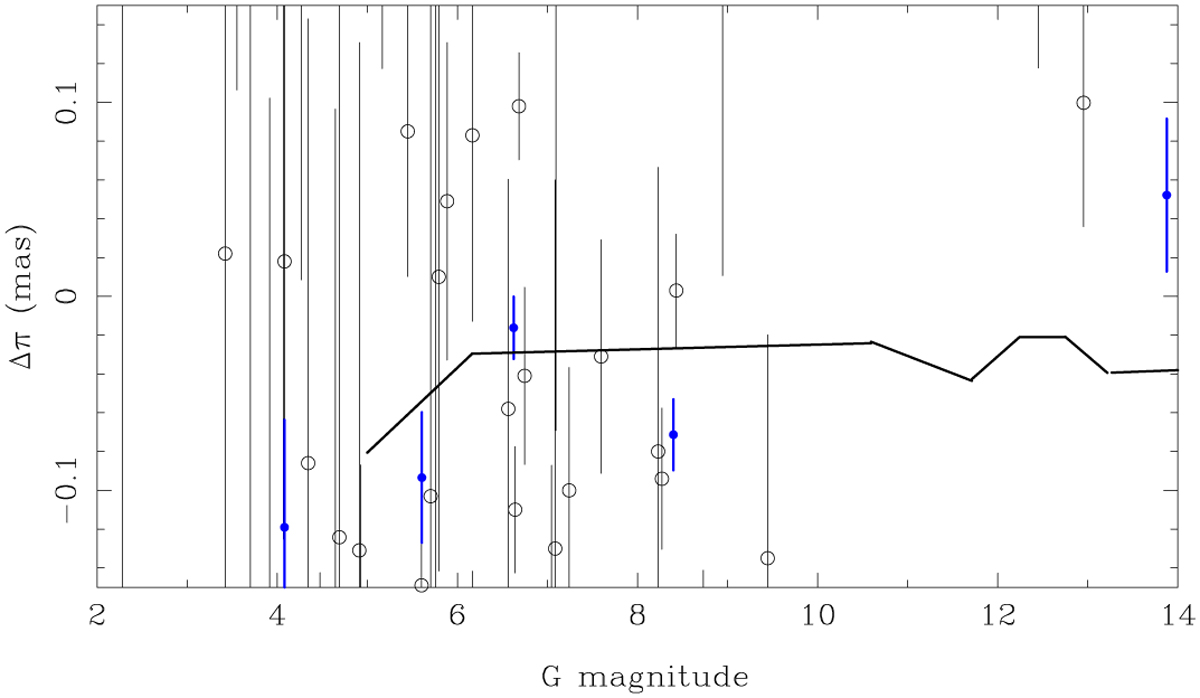
Zoom of Fig. 1, with the SS applied as described in the text. There are points outside the plot range. The blue points are the weighted averages plotted at the mean magnitude of the objects in the magnitude bins. The solid lines represent the magnitude dependence of the PZPO from G21 with an average spatial correction of −0.013 mas added.
Current usage metrics show cumulative count of Article Views (full-text article views including HTML views, PDF and ePub downloads, according to the available data) and Abstracts Views on Vision4Press platform.
Data correspond to usage on the plateform after 2015. The current usage metrics is available 48-96 hours after online publication and is updated daily on week days.
Initial download of the metrics may take a while.