Fig. 5
Download original image
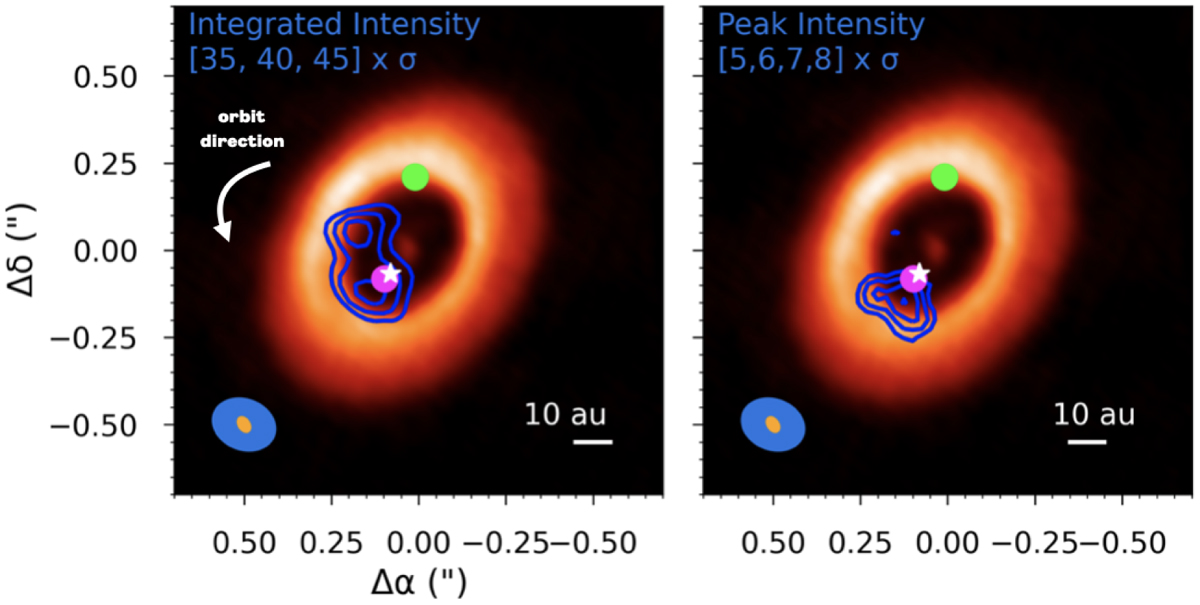
Composite image showing the 0.9 mm dust emission from Pineda et al. (2019), the [30,35,40]×σ (where σ is the rms noise of an integrated-intensity map generated without a Keplerian mask over the same number of channels) contours of the stacked SO Keplerian-masked integrated-intensity map (left) and the [5,6,7,8]×σ (where σ is the channel map noise) contours of the peak intensity map (right) imaged with a Briggs robust parameter of 0.0. The location of the putative planet HD 100546 c (purple, Currie et al. 2015) and the putative planet from (Casassus & Pérez 2019, green) are highlighted with circles. The excess CO signal from Brittain et al. 2019 in 2017 is shown by the white star symbol. Beams for the continuum observations (orange) and the line data (blue) are shown in the bottom left corner. The arrow marks the orbital direction of the disk material and planet(s).
Current usage metrics show cumulative count of Article Views (full-text article views including HTML views, PDF and ePub downloads, according to the available data) and Abstracts Views on Vision4Press platform.
Data correspond to usage on the plateform after 2015. The current usage metrics is available 48-96 hours after online publication and is updated daily on week days.
Initial download of the metrics may take a while.