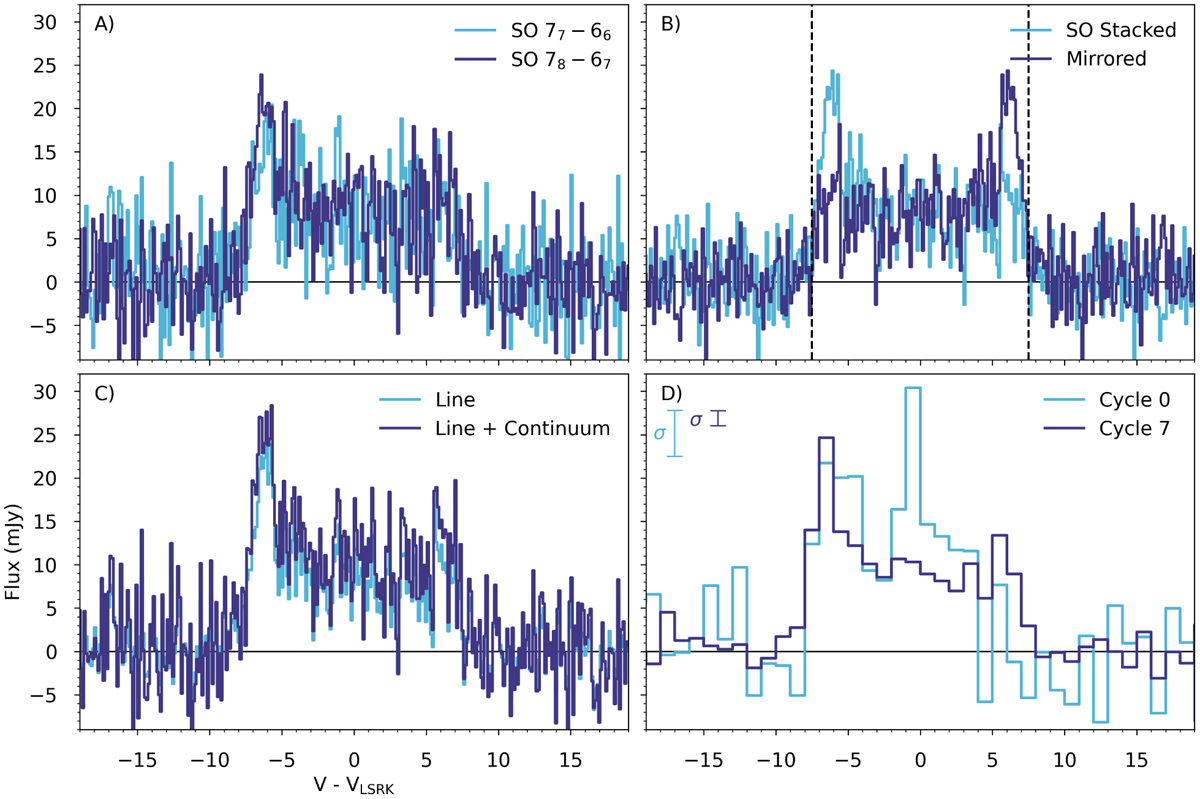
Fig. 2
Download original image
Spectra extracted from a 0″.6 ellipse. (A) Individual transitions. (B) Spectra of the two stacked SO lines, and the same spectra mirrored. (C) Spectra of the two stacked SO lines with continuum subtraction and without continuum subtraction in the UV domain (after subtracting the average value of the line-free continuum emission channels). (D) Spectra of the two stacked SO lines from the ALMA Cycle 0 observations presented in Booth et al. (2018) and the Cycle 7 observations presented in this work. The Cycle 7 data have been imaged at 1.0 km s−1 in order to make a direct comparison to the Cycle 0 data. The noise calculated from the line-free channels in each respective spectrum is shown by a bar in the top left corner of the plot.
Current usage metrics show cumulative count of Article Views (full-text article views including HTML views, PDF and ePub downloads, according to the available data) and Abstracts Views on Vision4Press platform.
Data correspond to usage on the plateform after 2015. The current usage metrics is available 48-96 hours after online publication and is updated daily on week days.
Initial download of the metrics may take a while.