Fig. 4
Download original image
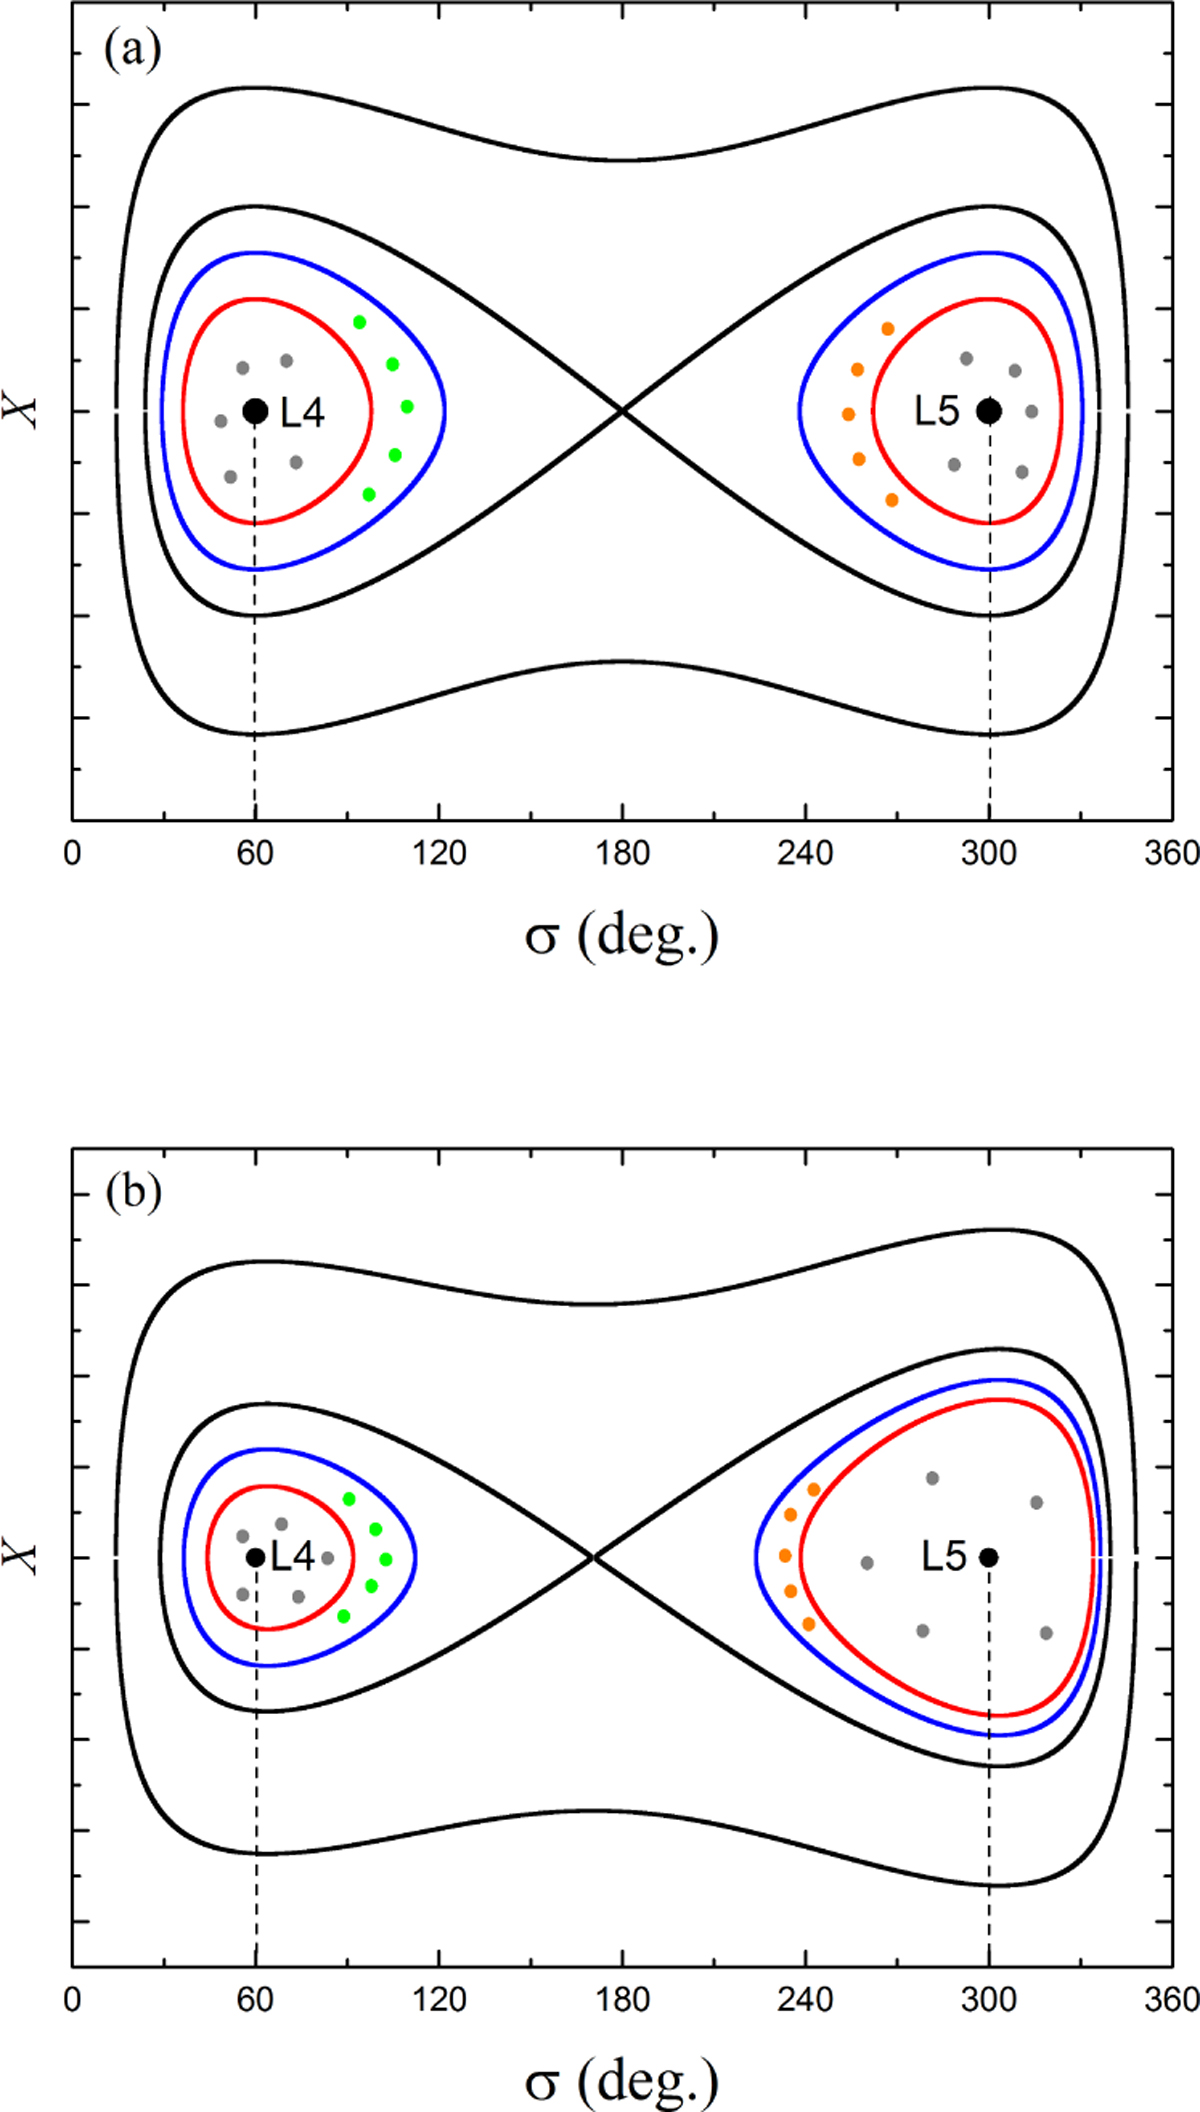
Phase space of the co-orbital motion near Jupiter’s L4 and L5 points for the non-migrating Jupiter (panel a) and an outward migrating Jupiter with a speed of 1.5 × 10⁻⁴ AU yr−1 (panel b). This figure is generated by the theory developed in Sicardy & Dubois (2003), and the ordinate denotes the parameter X that is proportional to the distance of the Trojan with respect to Jupiter. The blue curve represents the stability limit of Jupiter Trojans, and the adjacent green (around L4) and orange (around L5) dots indicate the Trojans with large resonant amplitudes. Interior to the red curve, the Trojans (grey dots) with smaller resonant amplitudes are more stable. During the outward migration of Jupiter, the L4 Trojans drift towards the L4 point due to the contraction of the librational islands, while the L5 Trojans move away from the L5 point due to the expansion of the librational islands. For reference, the vertical dashed lines are plotted corresponding to the L4 and L5 points respectively.
Current usage metrics show cumulative count of Article Views (full-text article views including HTML views, PDF and ePub downloads, according to the available data) and Abstracts Views on Vision4Press platform.
Data correspond to usage on the plateform after 2015. The current usage metrics is available 48-96 hours after online publication and is updated daily on week days.
Initial download of the metrics may take a while.