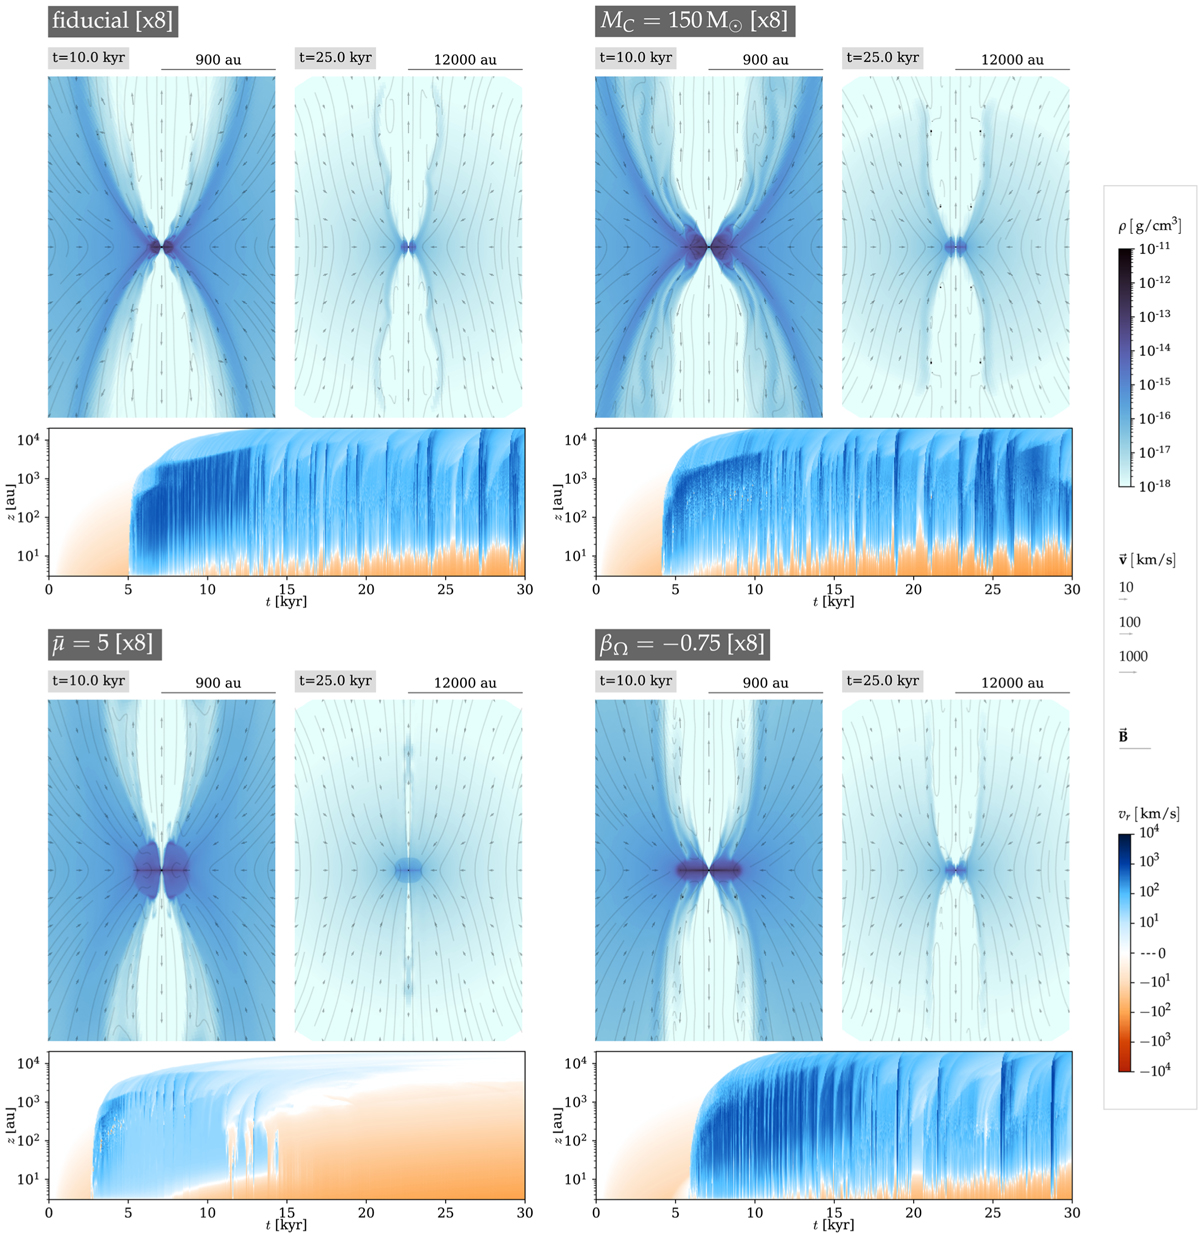
Fig. 10
Download original image
Morphology and kinematics of the outflows for different initial conditions, using the grid ×8. The velocities shown as a function of time correspond to the maximum radial velocity within an angle of 22.5° from the rotation axis, and the logarithmic scale has a cutoff of ±1 (velocities in the interval −1 ≤ υr ≤ 1 km s−1 are shown as zero).
Current usage metrics show cumulative count of Article Views (full-text article views including HTML views, PDF and ePub downloads, according to the available data) and Abstracts Views on Vision4Press platform.
Data correspond to usage on the plateform after 2015. The current usage metrics is available 48-96 hours after online publication and is updated daily on week days.
Initial download of the metrics may take a while.