Fig. 1.

Download original image
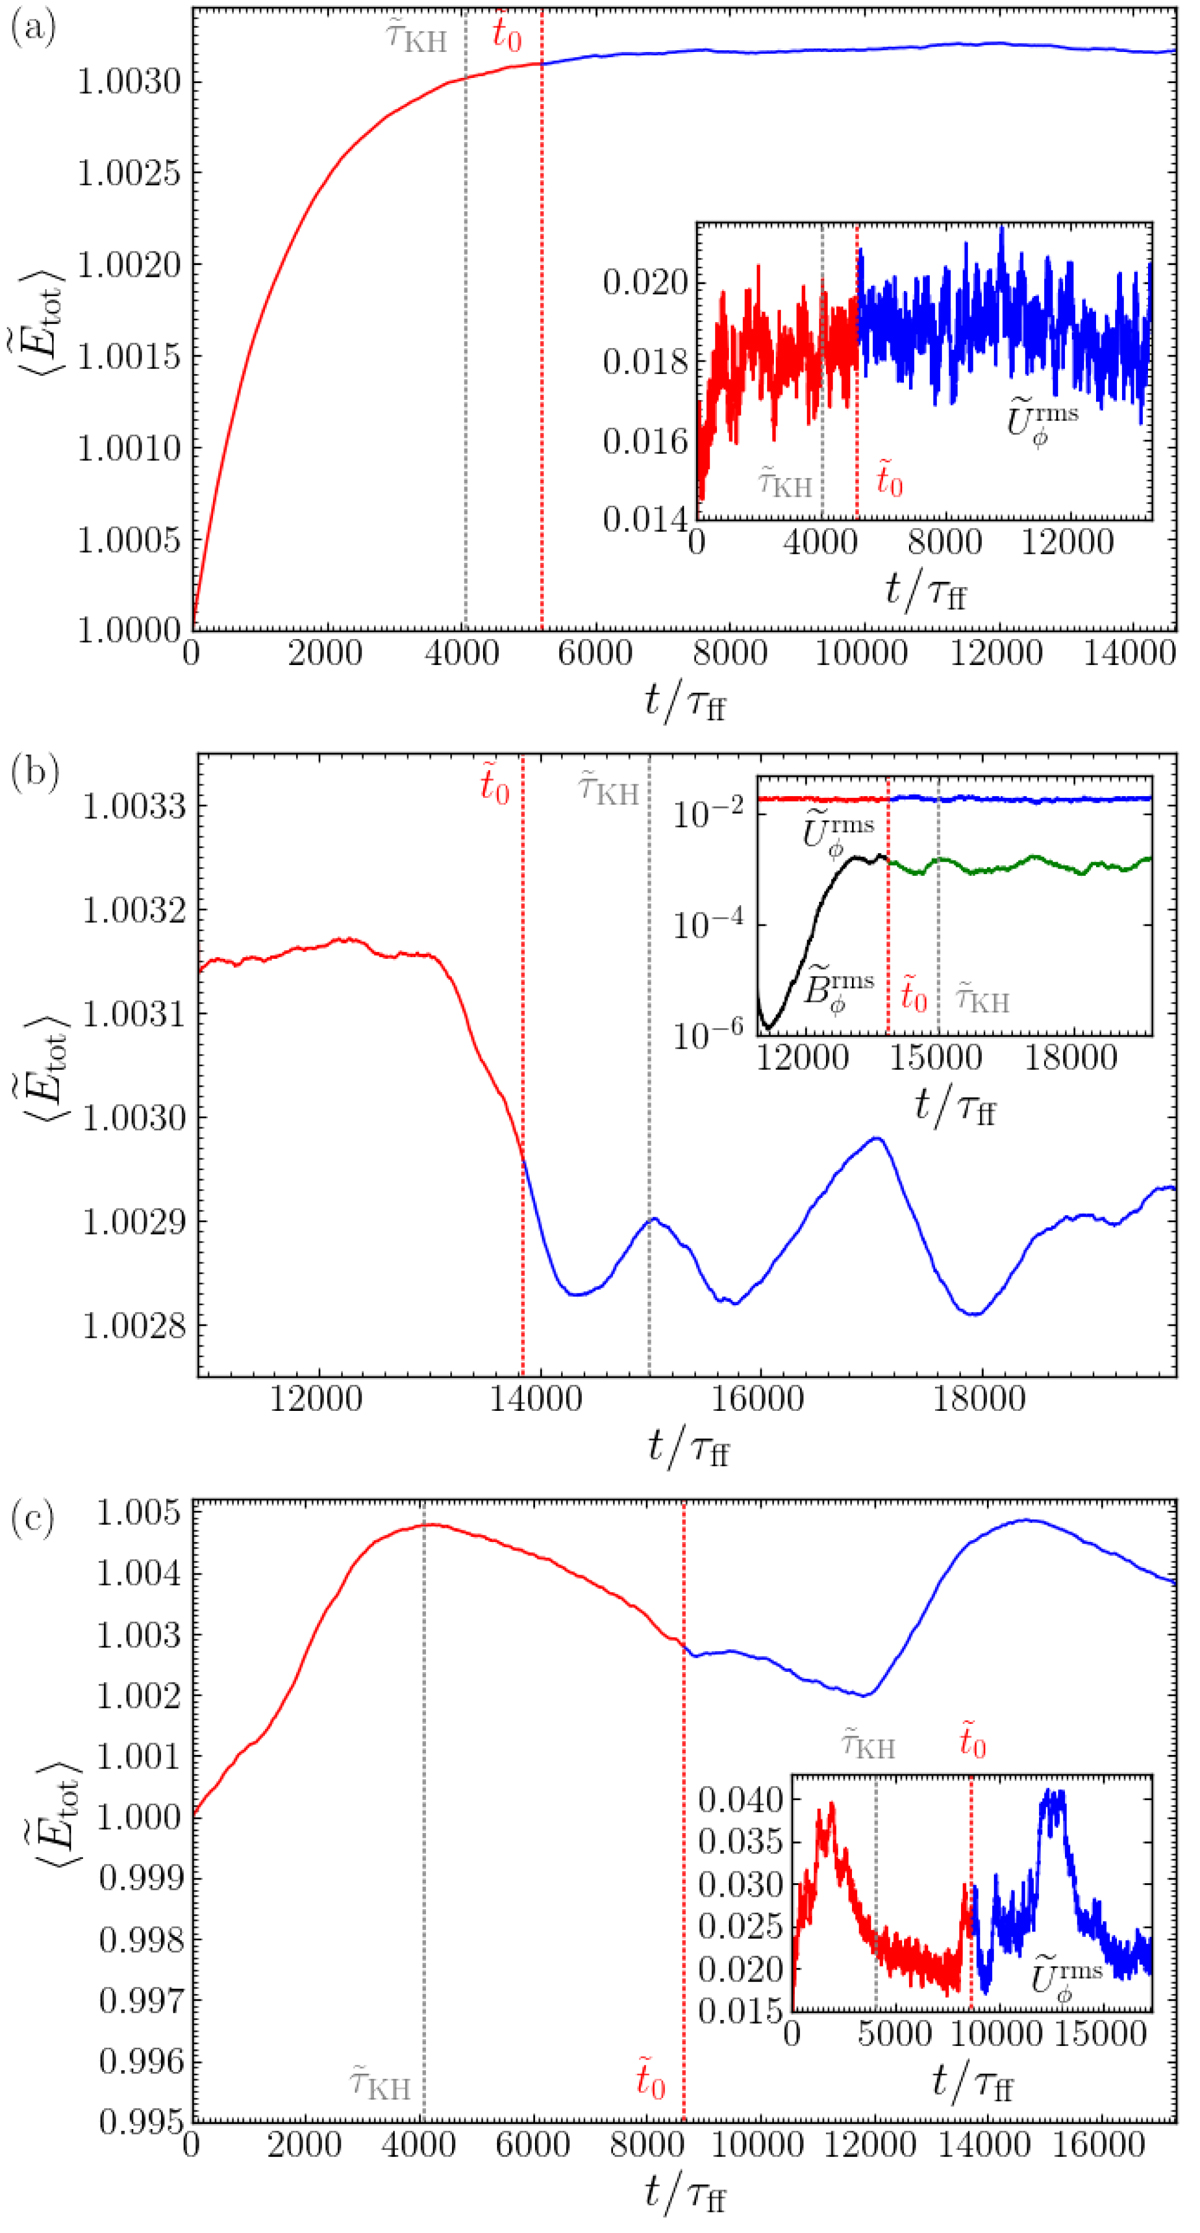
Time series of total energy density and the rms velocity and magnetic fields. (a) Volume-averaged total energy density ⟨Etot⟩ normalized by its value at t = 0 from run P1-6H. The inset shows the volume-averaged rms value of the azimuthal flow ![]() . The red (blue) part of the curve indicates the transient (statistically stationary) part of the time series, where
. The red (blue) part of the curve indicates the transient (statistically stationary) part of the time series, where ![]() indicates the starting time for the time averaging. τKH indicates the Kelvin-Helmholtz timescale. (b) Same as above, but for the corresponding MHD run P1-6M. The inset shows
indicates the starting time for the time averaging. τKH indicates the Kelvin-Helmholtz timescale. (b) Same as above, but for the corresponding MHD run P1-6M. The inset shows ![]() in addition to
in addition to ![]() . The black (green) parts of the data for
. The black (green) parts of the data for ![]() indicate transient (statistically stationary) parts. (c) Same as panel a, but for run P01-3H.
indicate transient (statistically stationary) parts. (c) Same as panel a, but for run P01-3H.
Current usage metrics show cumulative count of Article Views (full-text article views including HTML views, PDF and ePub downloads, according to the available data) and Abstracts Views on Vision4Press platform.
Data correspond to usage on the plateform after 2015. The current usage metrics is available 48-96 hours after online publication and is updated daily on week days.
Initial download of the metrics may take a while.


