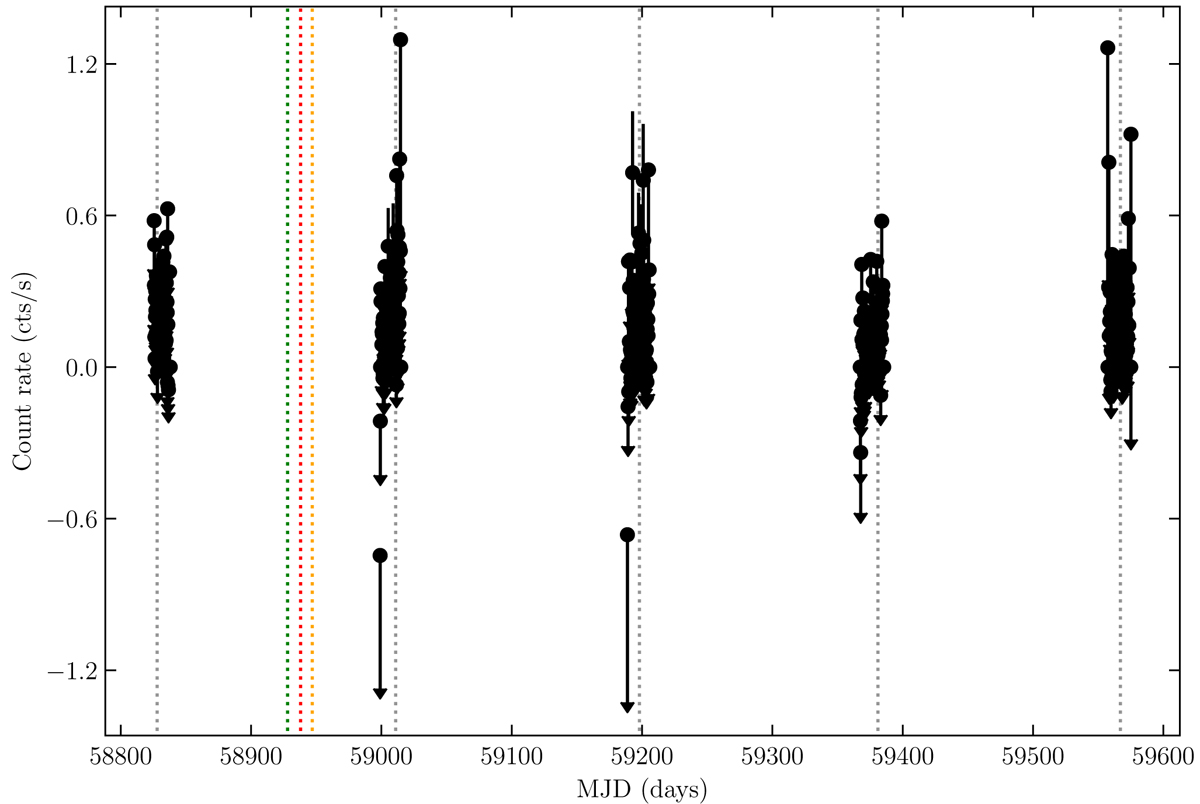
Fig. 1.
Download original image
eROSITA light curve of eRASSU J052914.9−662446 in the five epochs from eRASS0 to the beginning of eRASS5. Each point represents a single scan over the source. The dotted green, red, and orange lines indicate the date of the SALT, Swift, and NuSTAR follow-up observations, respectively. The dotted black lines indicate the formal transitions between different eRASSs. Error bars in the y-direction show the 1σ uncertainties assuming Poisson statistics. Count rates of bins with fewer than ten counts are plotted as 1σ upper limits.
Current usage metrics show cumulative count of Article Views (full-text article views including HTML views, PDF and ePub downloads, according to the available data) and Abstracts Views on Vision4Press platform.
Data correspond to usage on the plateform after 2015. The current usage metrics is available 48-96 hours after online publication and is updated daily on week days.
Initial download of the metrics may take a while.