Fig. A.1.
Download original image
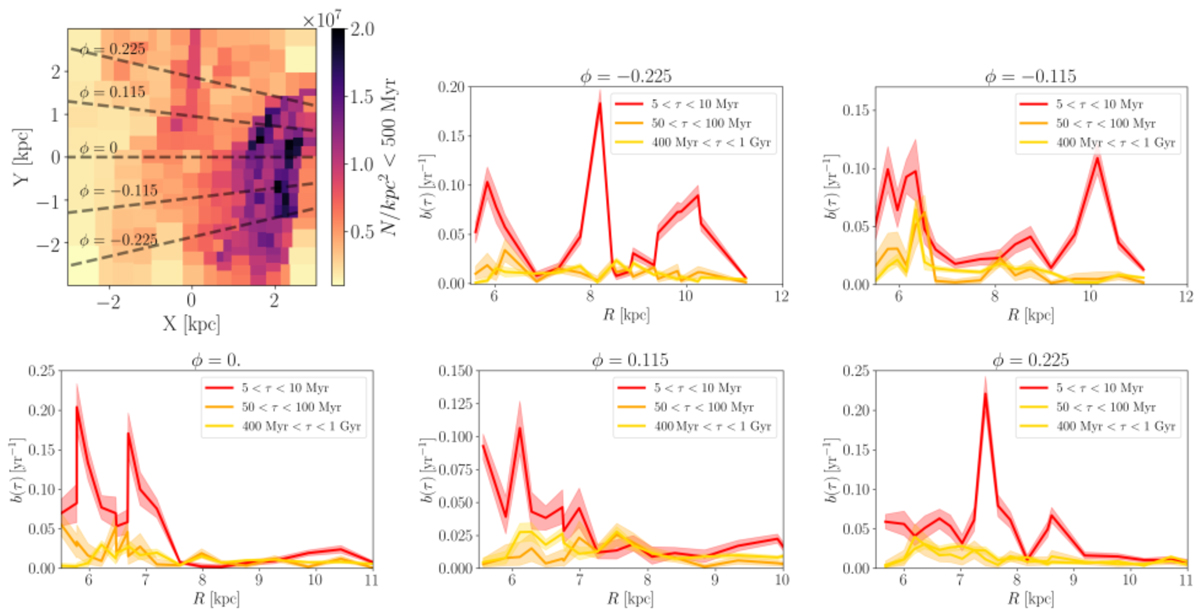
Birthrates as a function of galactocentric radius and azimuths. Top left: Same as Fig. 3, the dashed lines correspond to the different azimuths considered. Top centre, right, and bottom: Birthrate as a function of galactocentric radius for three different age intervals at five different azimuths (as indicated in the panels). The colour scheme is the same as in Fig. 5. The thick lines correspond to the average birthrate, and the shaded areas correspond to the 16th and 84th percentiles.
Current usage metrics show cumulative count of Article Views (full-text article views including HTML views, PDF and ePub downloads, according to the available data) and Abstracts Views on Vision4Press platform.
Data correspond to usage on the plateform after 2015. The current usage metrics is available 48-96 hours after online publication and is updated daily on week days.
Initial download of the metrics may take a while.