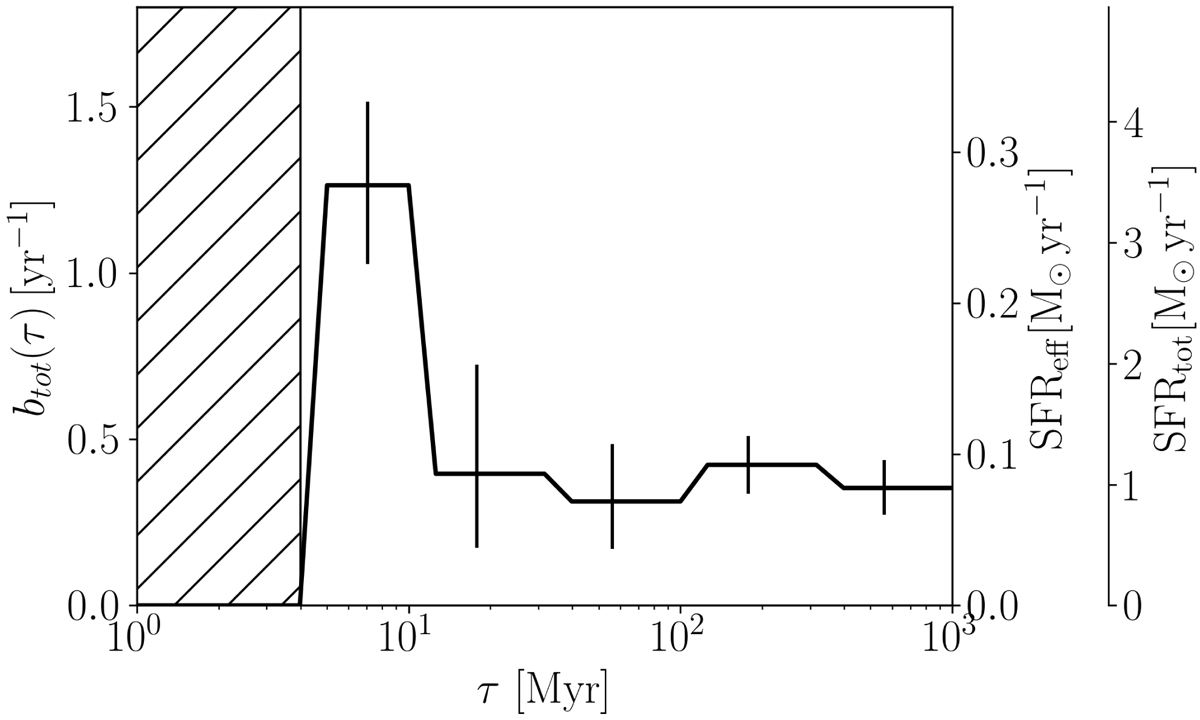
Fig. 7.
Download original image
Effective star formation history of the sample, in units of yr−1 (left y-axis) and M⊙ yr−1 (first right y-axis). The second right y-axis corresponds to the total SFR obtained by multiplying by the ratio f = SFR5 − 11/SFRtot (see Sect. 5). Vertical bars correspond to errors on the parameters. Ages below 5 Myr are not included in our analysis, and thus the corresponding area in the plot is hatched.
Current usage metrics show cumulative count of Article Views (full-text article views including HTML views, PDF and ePub downloads, according to the available data) and Abstracts Views on Vision4Press platform.
Data correspond to usage on the plateform after 2015. The current usage metrics is available 48-96 hours after online publication and is updated daily on week days.
Initial download of the metrics may take a while.