Fig. 6.
Download original image
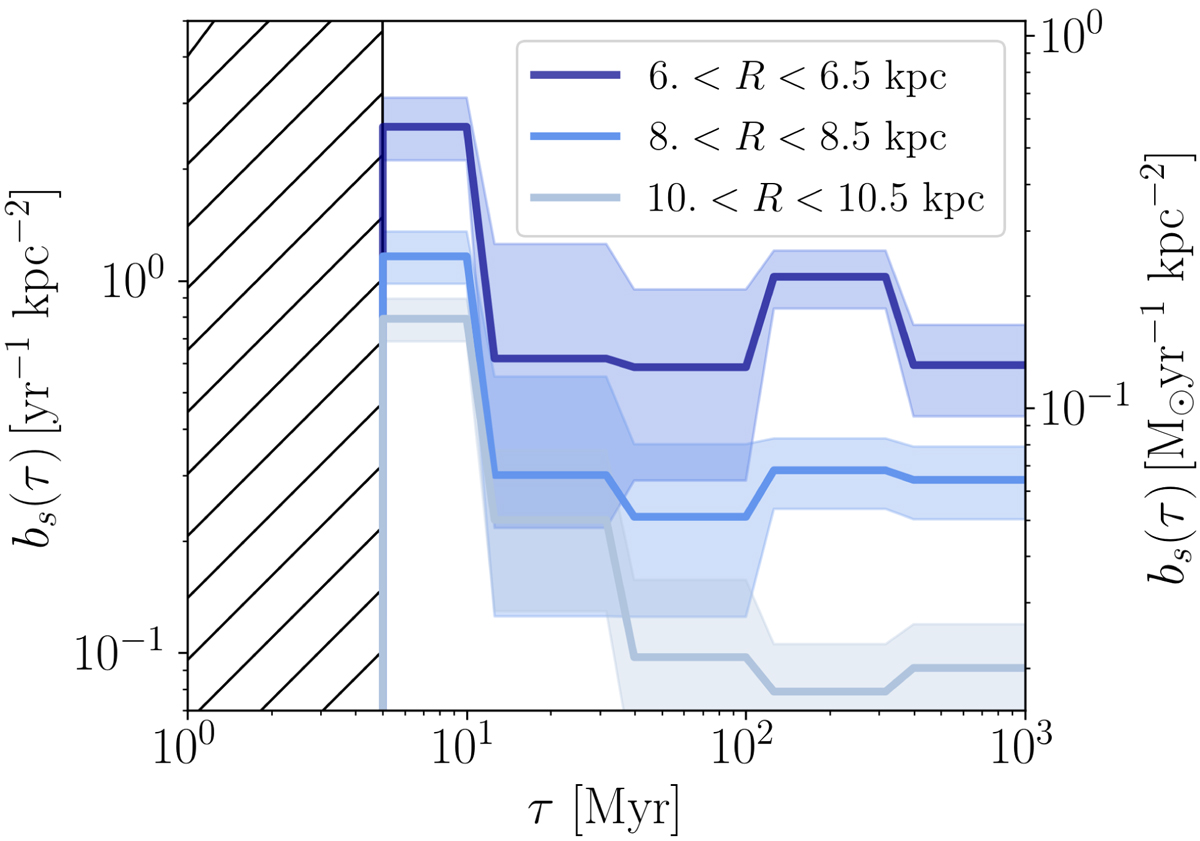
Star formation rate density in different galactocentric radii, as a function of time. The left and right Y-axes show the SFR expressed as the total number of stars born and as the stellar mass formed, respectively. The thick lines correspond to the average star formation rate surface density for three intervals in galactocentric radius. The shades areas correspond to the 16th and 84th percentiles. Ages below 5 Myr are not included in our analysis, and thus the corresponding area in the plot is hatched.
Current usage metrics show cumulative count of Article Views (full-text article views including HTML views, PDF and ePub downloads, according to the available data) and Abstracts Views on Vision4Press platform.
Data correspond to usage on the plateform after 2015. The current usage metrics is available 48-96 hours after online publication and is updated daily on week days.
Initial download of the metrics may take a while.