Fig. 5.
Download original image
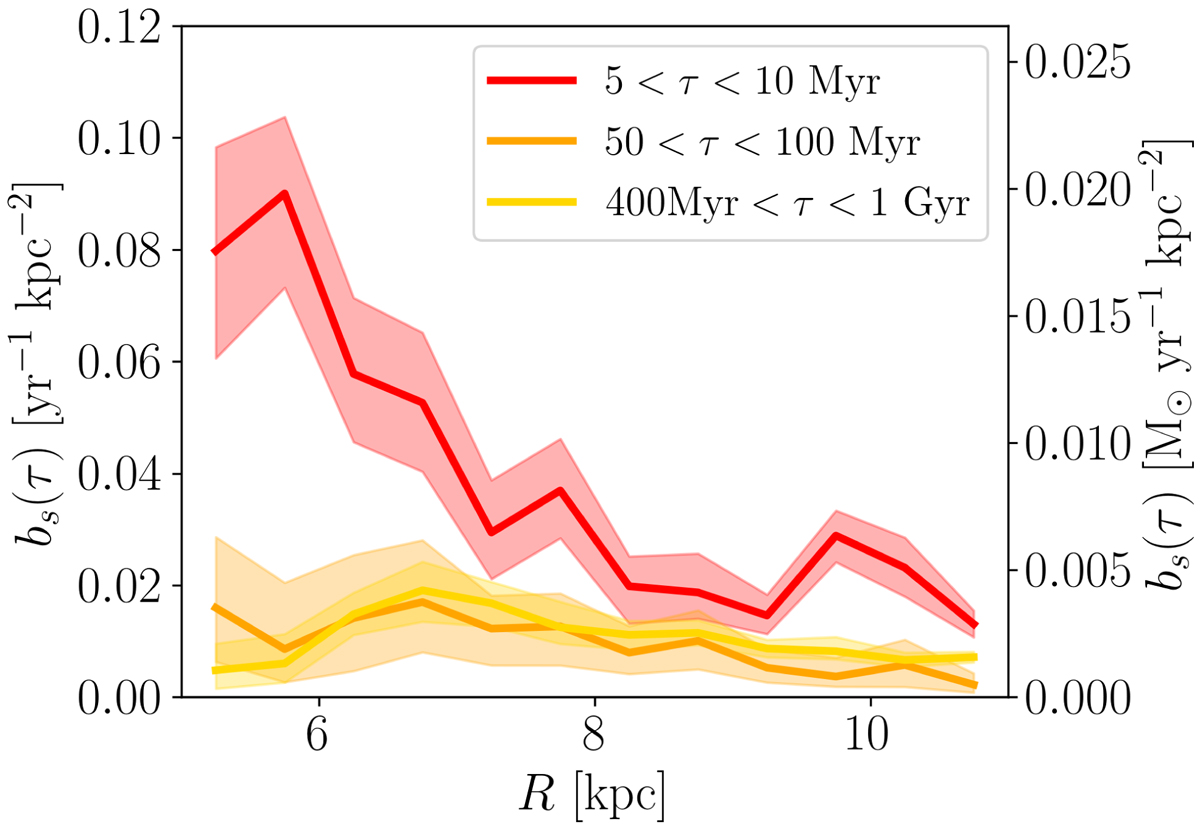
Distribution of star formation rate surface density as a function of galactocentric radius. The thick lines correspond to the average star formation rate surface density for different age intervals (red: 5 < τ < 10 Myr; orange: 50 < τ < 100 Myr; yellow: 400 < Myrτ < 1 Gyr). The shaded areas correspond to the 16th and 84th percentiles. The left Y-axis shows the star formation rate expressed as the total number of stars born; the right Y-axis shows the more conventional amount of stellar mass formed, which requires the adoption of an IMF (here, Kroupa 2001).
Current usage metrics show cumulative count of Article Views (full-text article views including HTML views, PDF and ePub downloads, according to the available data) and Abstracts Views on Vision4Press platform.
Data correspond to usage on the plateform after 2015. The current usage metrics is available 48-96 hours after online publication and is updated daily on week days.
Initial download of the metrics may take a while.