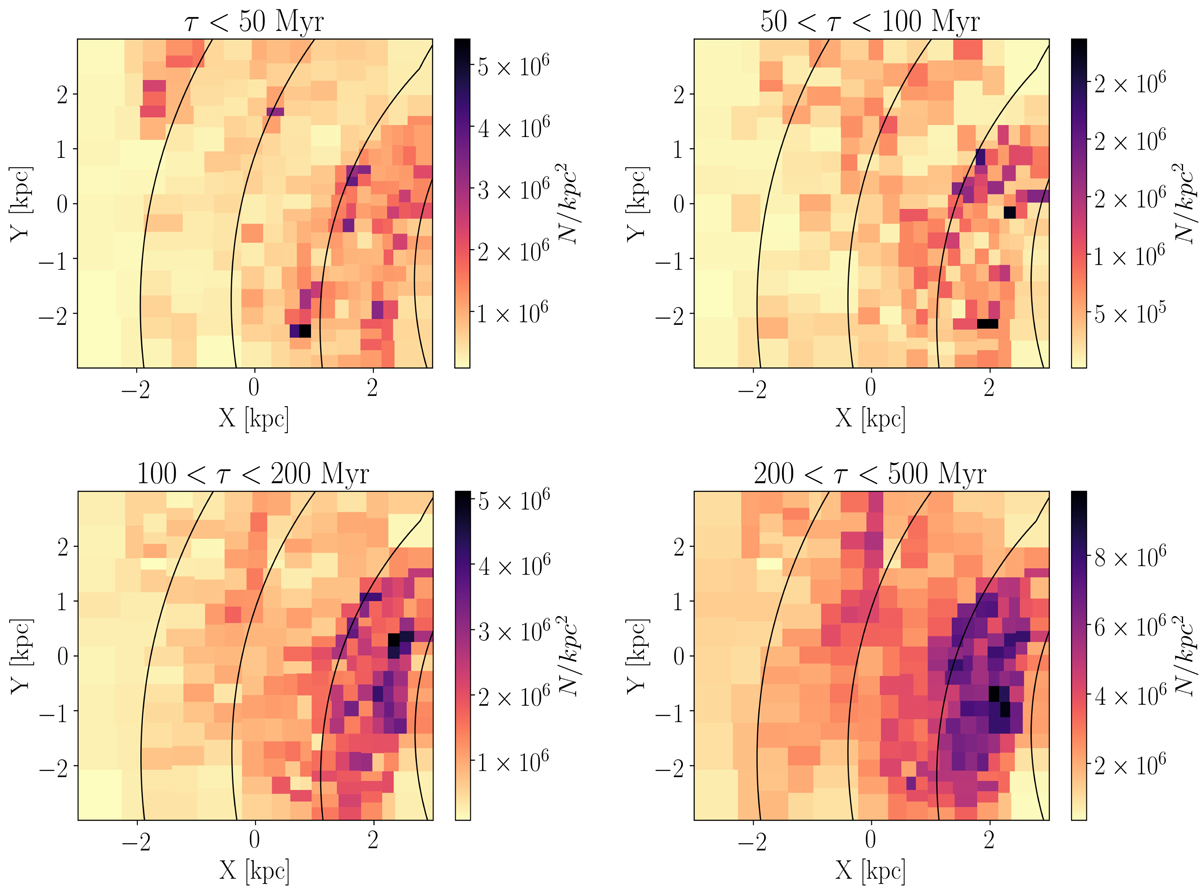
Fig. 4.
Download original image
Density distribution of stars with ages of 5 < t < 50 Myr (top left), 50 < t < 100 Myr (top right), 100 < t < 200 Myr (bottom left), and 200 < t < 500 Myr (bottom right). The density distribution changes as a function of time, becoming gradually smoother. Over-arching structures corresponding to spiral arms are visible for all age intervals. The solid black lines indicate the location of the spiral arms from Reid et al. (2019).
Current usage metrics show cumulative count of Article Views (full-text article views including HTML views, PDF and ePub downloads, according to the available data) and Abstracts Views on Vision4Press platform.
Data correspond to usage on the plateform after 2015. The current usage metrics is available 48-96 hours after online publication and is updated daily on week days.
Initial download of the metrics may take a while.