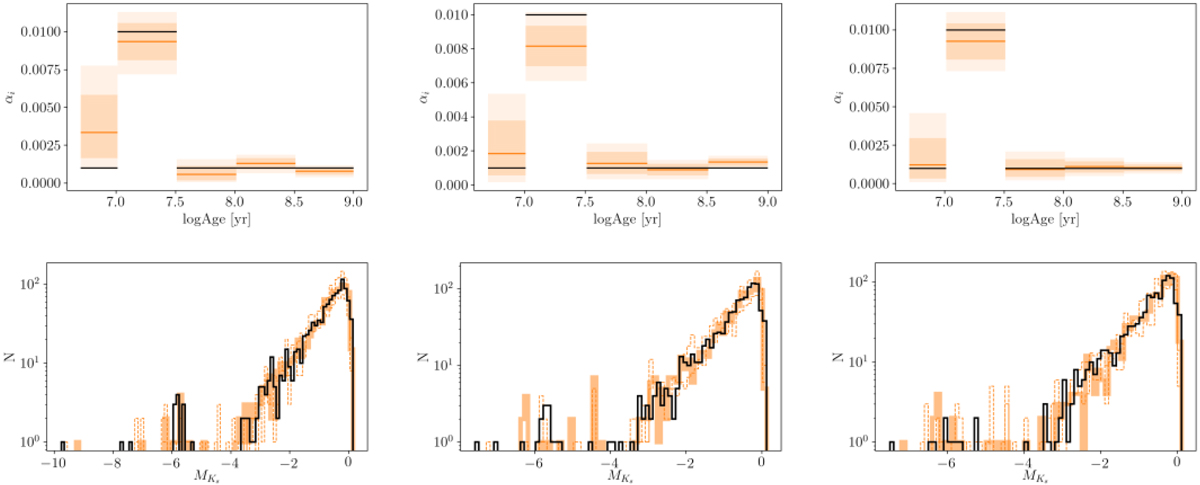
Fig. 2.
Download original image
Model fits to mock datasets used as tests. Top row: black lines show the true value of the birthrate αi parameters. The orange lines show the estimated αi parameters for three different realisations of the mock datasets generated from the same initial parameters. The orange shaded areas correspond to the 1- and 2-σ levels. Bottom row: black histograms represent the magnitude distribution of three different mock datasets. The thick orange histograms represent the magnitude distribution obtained by using the best fit αi. The dashed histograms represent the magnitude distribution obtained by using the 16th and 84th percentiles for αi.
Current usage metrics show cumulative count of Article Views (full-text article views including HTML views, PDF and ePub downloads, according to the available data) and Abstracts Views on Vision4Press platform.
Data correspond to usage on the plateform after 2015. The current usage metrics is available 48-96 hours after online publication and is updated daily on week days.
Initial download of the metrics may take a while.