Fig. 1.
Download original image
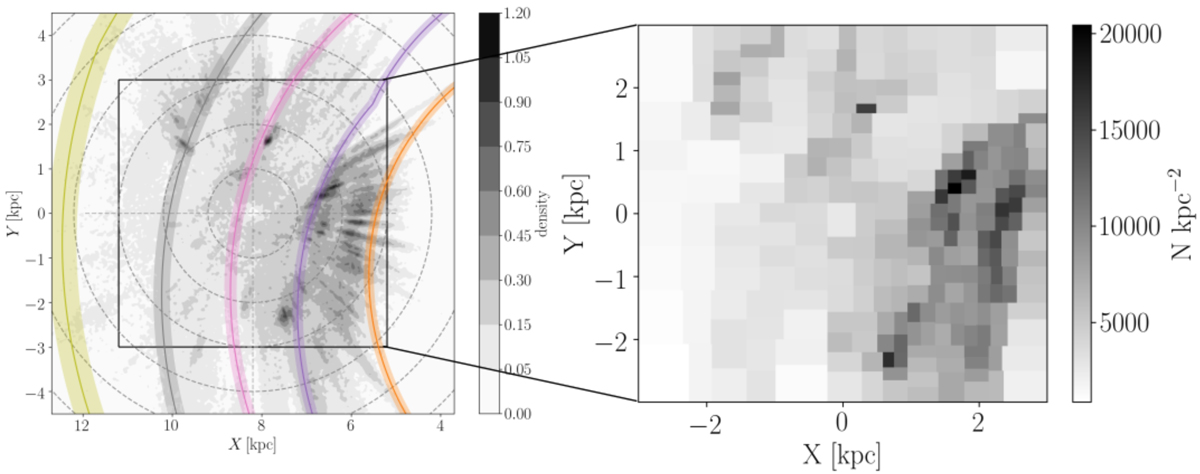
Density distribution of the filtered sample of massive hot stars from Zari et al. (2021). In the left panel, the coloured lines represent the spiral arm locations derived by Reid et al. (2019). The right panel highlights the 6 × 6 kpc region considered in this study. Such region is divided in ‘spaxels’ of different sizes, each containing the same number of sources. In both panels, the Sun is in X, Y = (0, 0).
Current usage metrics show cumulative count of Article Views (full-text article views including HTML views, PDF and ePub downloads, according to the available data) and Abstracts Views on Vision4Press platform.
Data correspond to usage on the plateform after 2015. The current usage metrics is available 48-96 hours after online publication and is updated daily on week days.
Initial download of the metrics may take a while.