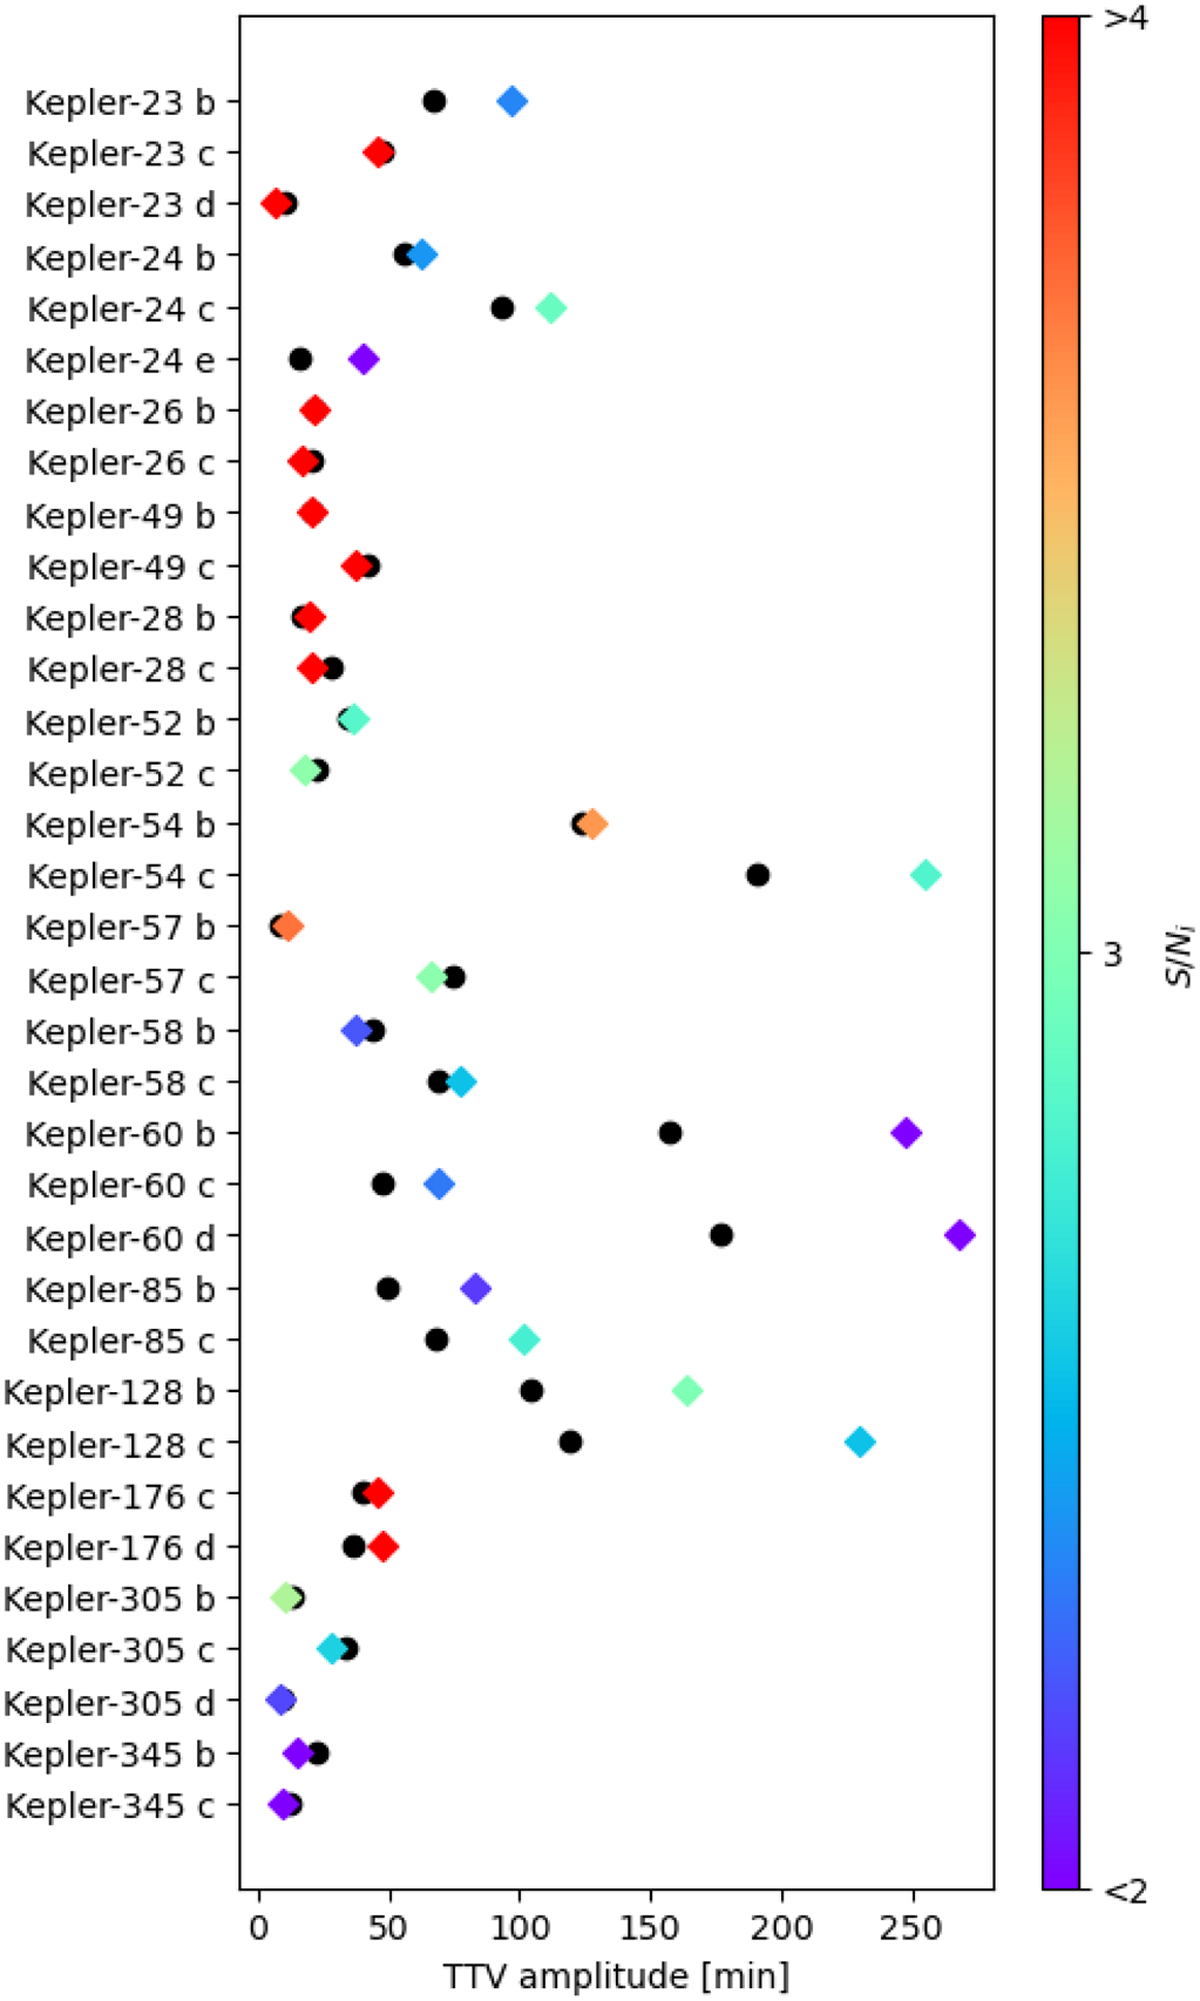
Fig. 6
Download original image
Peak-to-peak TTV amplitudes of the sinusoidal approximation of all of the planets that were analysed in this study. Black points are fits to the pre-extracted timings published by Rowe et al. (2015), which for Kepler-128 and Kepler-60 correspond to the red-dashed curves in Figs. 4 and 5. The coloured diamonds show the peak-to-peak amplitude of the sinusoidal approximation of the best fit of the photo-dynamical model (the green dashed curves in Figs. 4 and 5). The colour indicates the S/Ni of the planet. The agreement between pre-extracted timings and photo-dynamical fit is reduced for lower S/Ni. This is further highlighted in Fig. 7.
Current usage metrics show cumulative count of Article Views (full-text article views including HTML views, PDF and ePub downloads, according to the available data) and Abstracts Views on Vision4Press platform.
Data correspond to usage on the plateform after 2015. The current usage metrics is available 48-96 hours after online publication and is updated daily on week days.
Initial download of the metrics may take a while.