Open Access
Fig. 4
Download original image
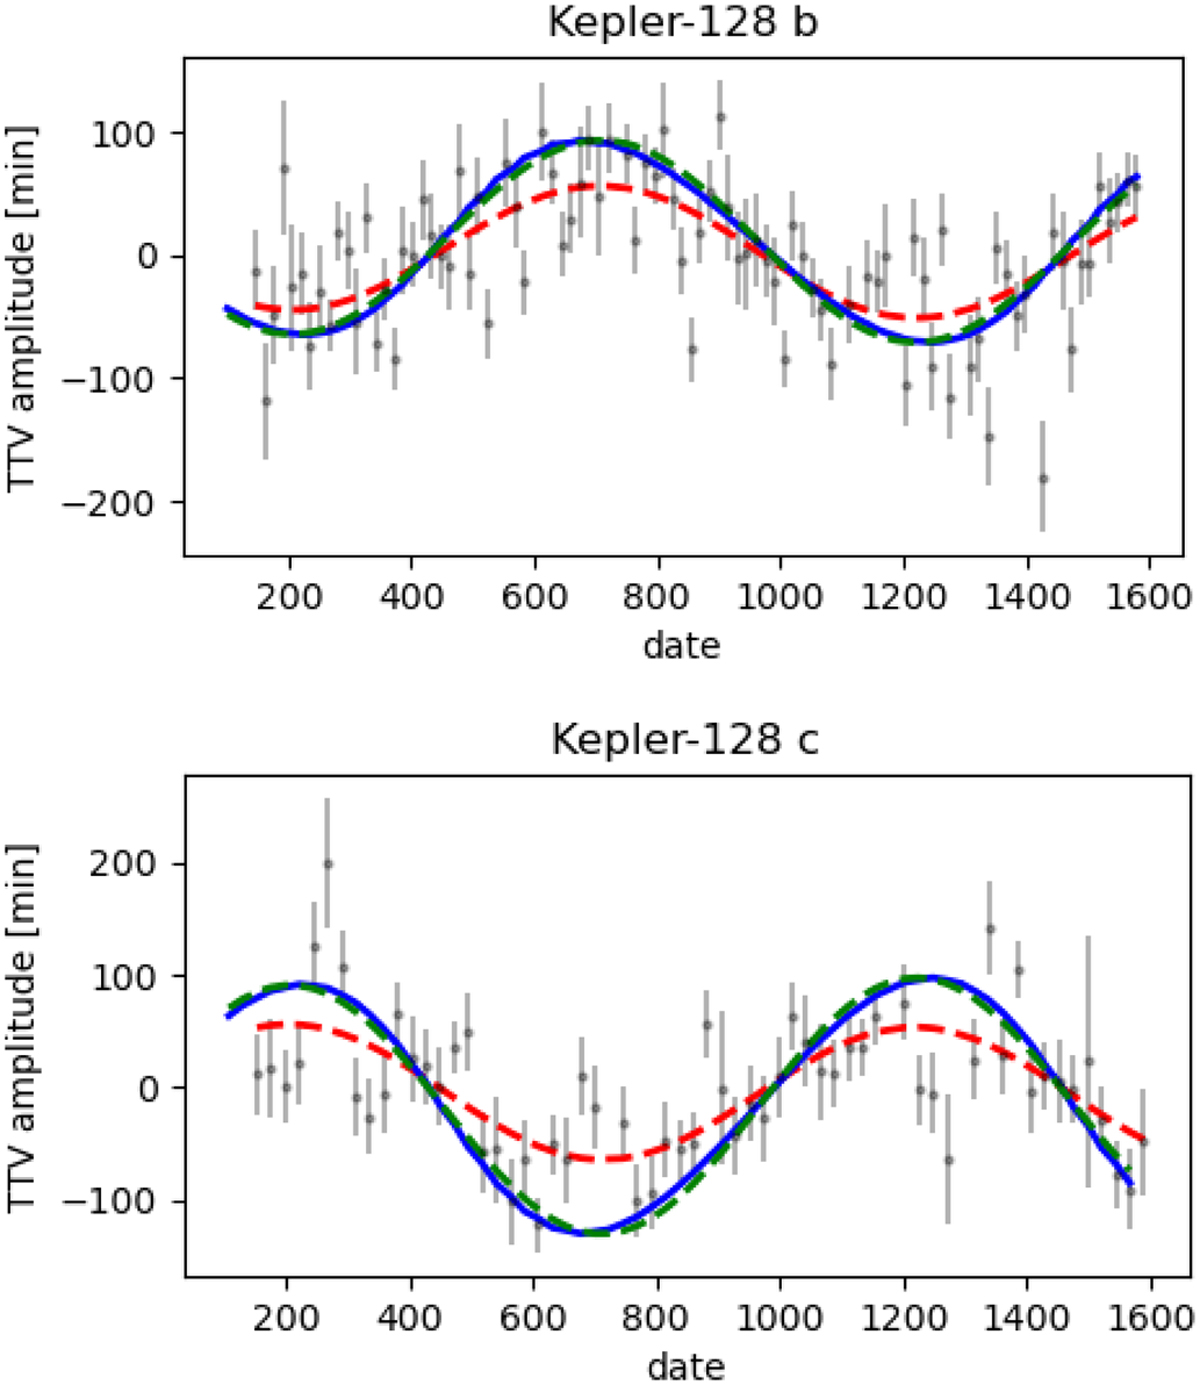
TTVs of the near-resonant pair Kepler-128 b,c. Black bars show the pre-extracted transit timings from Rowe et al. (2015), while blue bars show the best photodynamical fit. Dashed red and green curves show sinusoidal approximations for the pre-extracted transits and the photo-dynamical analysis respectively.
Current usage metrics show cumulative count of Article Views (full-text article views including HTML views, PDF and ePub downloads, according to the available data) and Abstracts Views on Vision4Press platform.
Data correspond to usage on the plateform after 2015. The current usage metrics is available 48-96 hours after online publication and is updated daily on week days.
Initial download of the metrics may take a while.