Fig. 11
Download original image
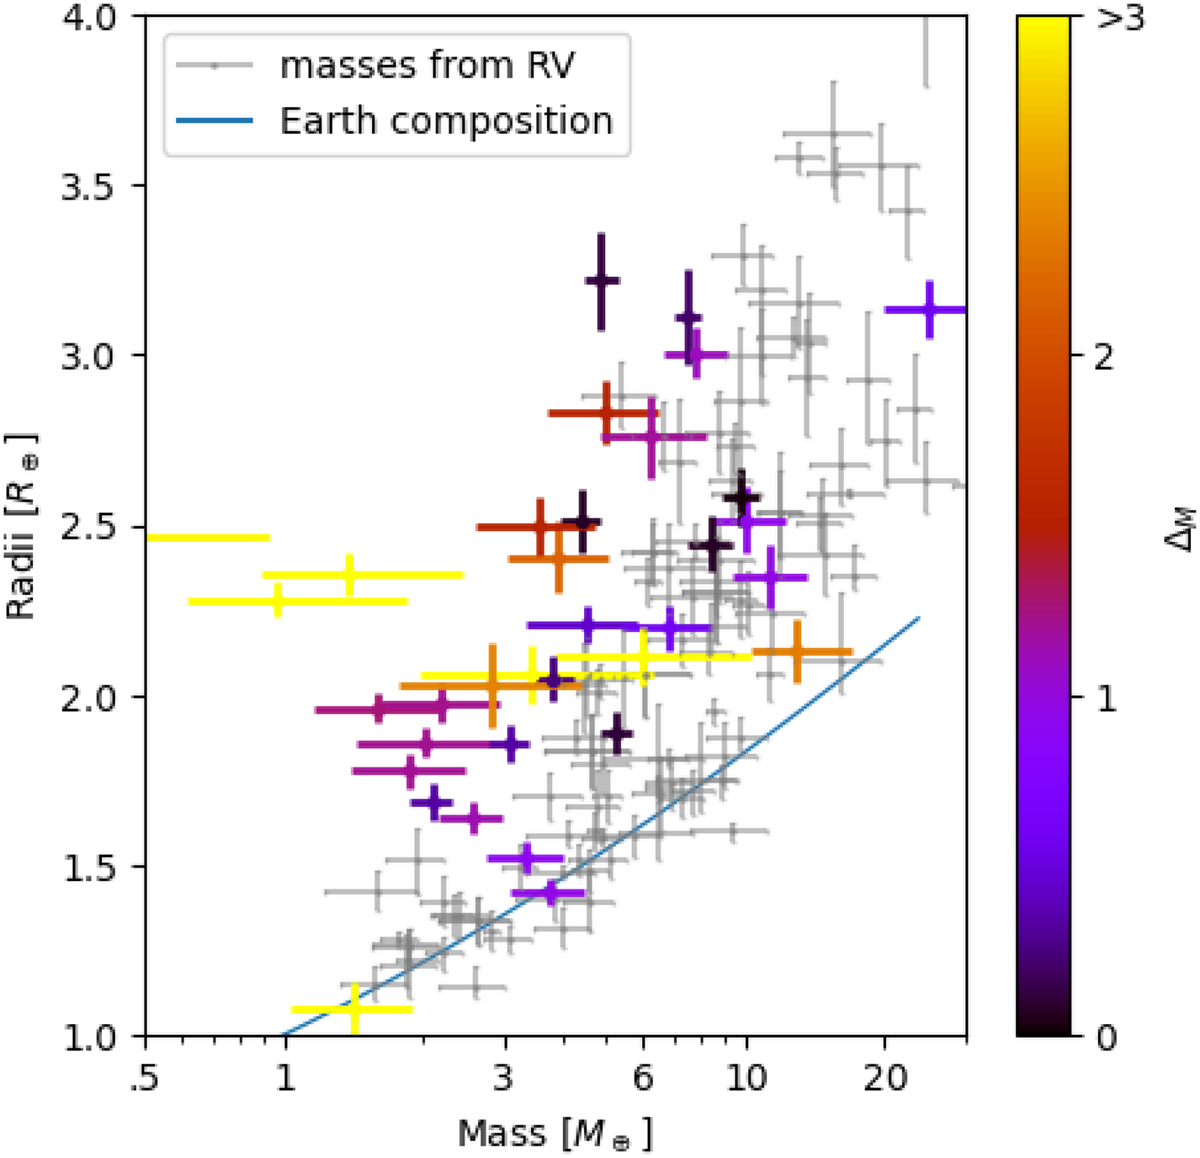
Mass-radius relationship of the re-analysed set of Kepler planets with the final posterior. The colour shows the degeneracy metric defined above Eq. (7): black-purple corresponds to well-constrained masses (low prior dependency), while red-yellow shows poorly constrained masses (high prior dependency). The grey background is the mass-radius relationship from RV-estimated masses.
Current usage metrics show cumulative count of Article Views (full-text article views including HTML views, PDF and ePub downloads, according to the available data) and Abstracts Views on Vision4Press platform.
Data correspond to usage on the plateform after 2015. The current usage metrics is available 48-96 hours after online publication and is updated daily on week days.
Initial download of the metrics may take a while.