Fig. 1
Download original image
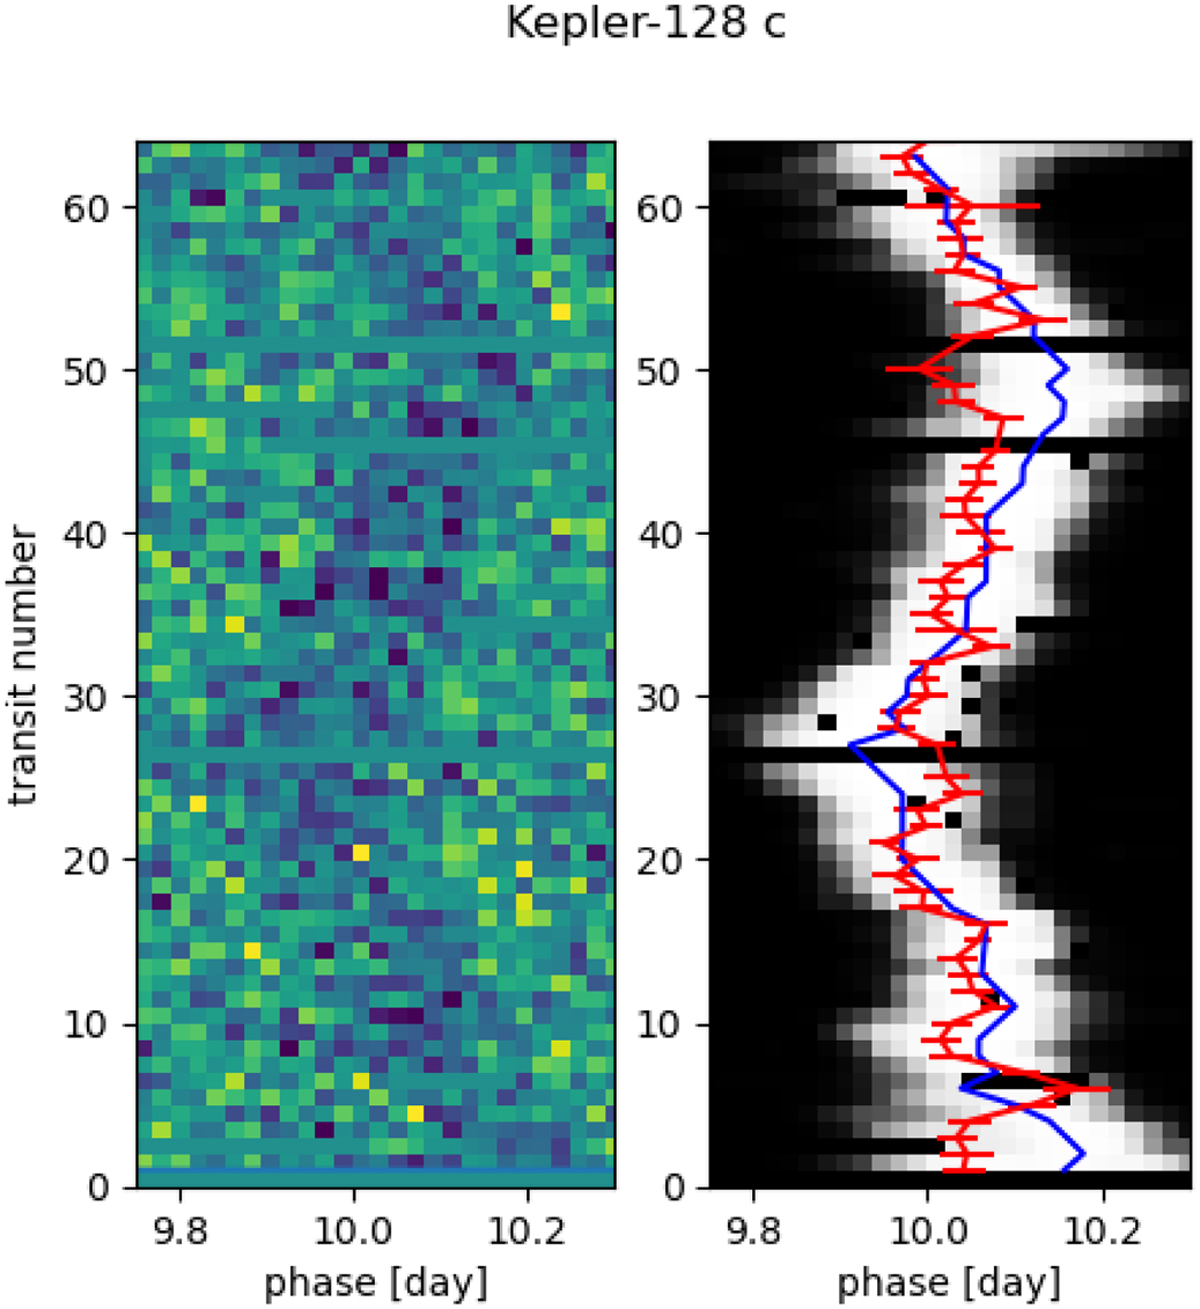
Zoom on the track of Kepler-128 c in a river diagram with a folding period of 22.8030 days. The left panel shows the detrended data with a clipping at 3σ. The right panel shows the corresponding confidence matrix which is the output of the RIVERS.deep algorithm. Black indicates noise or missing data; white indicates the track of a planet. The track having the highest confidence is highlighted in blue. For comparison, the transit timings reported by Rowe et al. (2015) are shown in red. See Fig. 4 for further comparisons.
Current usage metrics show cumulative count of Article Views (full-text article views including HTML views, PDF and ePub downloads, according to the available data) and Abstracts Views on Vision4Press platform.
Data correspond to usage on the plateform after 2015. The current usage metrics is available 48-96 hours after online publication and is updated daily on week days.
Initial download of the metrics may take a while.