Open Access
Fig. 5
Download original image
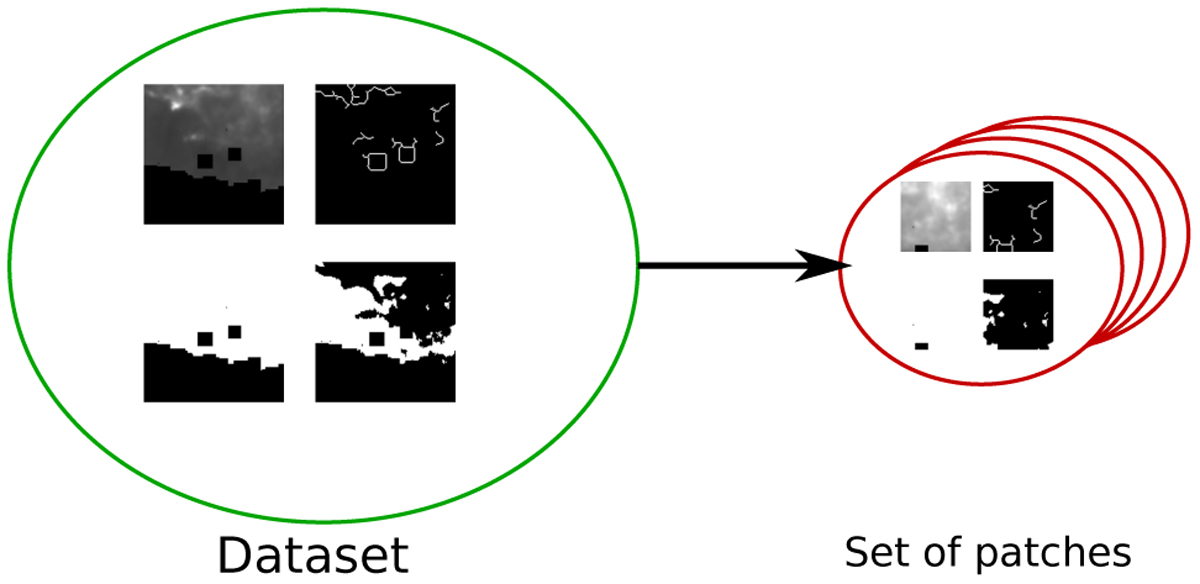
Building the data set using the four input maps (on the left) into a set of patches (on the right). On the left, the maps are the column density (top left), filament spine+branches (top right), missing data (bottom left), and background pixels (bottom right).
Current usage metrics show cumulative count of Article Views (full-text article views including HTML views, PDF and ePub downloads, according to the available data) and Abstracts Views on Vision4Press platform.
Data correspond to usage on the plateform after 2015. The current usage metrics is available 48-96 hours after online publication and is updated daily on week days.
Initial download of the metrics may take a while.