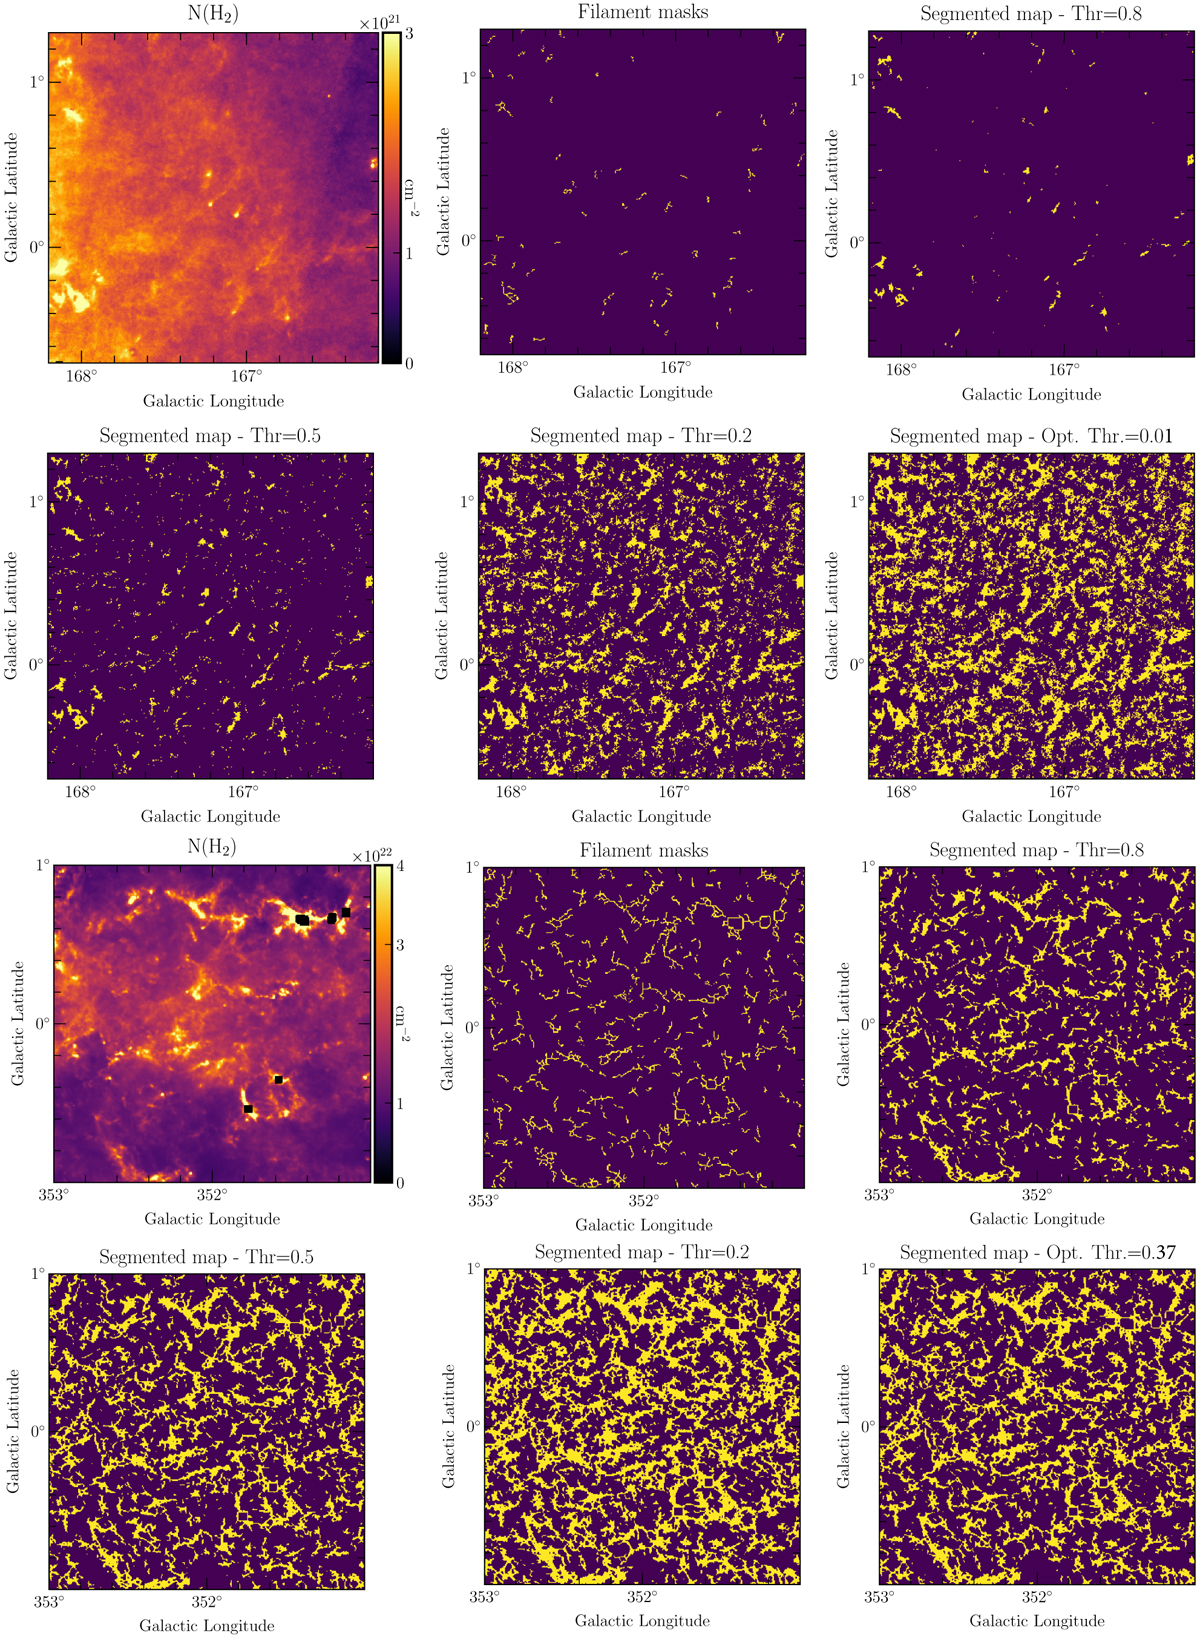
Fig. 20
Download original image
Zoom-in on the evolution of segmentation results generated by UNet++ 10–3 model in mosaics 160–171° (six top images) and 349–356° (six bottom images). Here, the estimated binary filament masks are displayed at classification thresholds 0.8, 0.5, 0.2, and the optimal threshold. The original H2 column density image (image with the color bar) and the true input filament mask are also displayed for comparison. The regions are 2° × 2° wide.
Current usage metrics show cumulative count of Article Views (full-text article views including HTML views, PDF and ePub downloads, according to the available data) and Abstracts Views on Vision4Press platform.
Data correspond to usage on the plateform after 2015. The current usage metrics is available 48-96 hours after online publication and is updated daily on week days.
Initial download of the metrics may take a while.