Fig. 18
Download original image
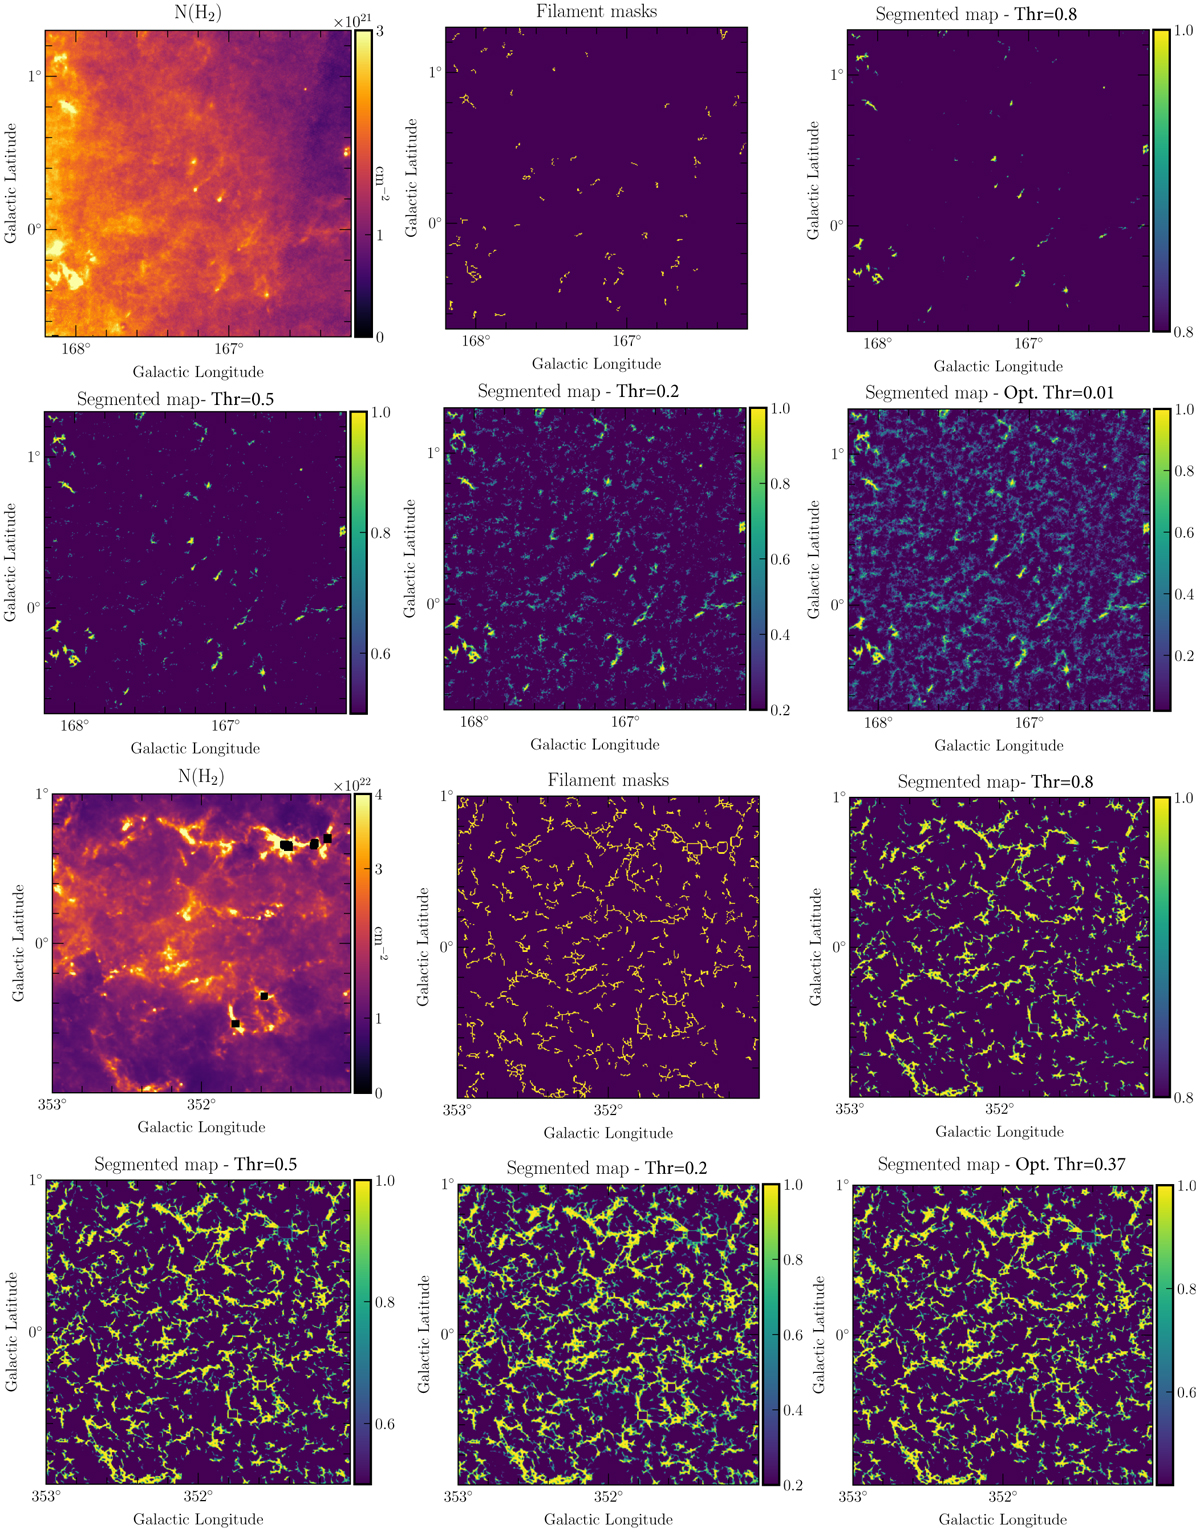
Zoom-in on the evolution of segmentation results as a function of the classification threshold showing the filamentary structures estimated by UNet++ 10–3 in 160–171° (six top images) and 349–356° (six bottom images) regions of the Galactic plane. The original H2 column density image (top left in each group), the ground-truth input filament mask, and the corresponding segmented image at different thresholds (0.8, 0.5, 0.2, and the optimal threshold) are shown from top left to bottom right. The regions are 2° × 2° wide.
Current usage metrics show cumulative count of Article Views (full-text article views including HTML views, PDF and ePub downloads, according to the available data) and Abstracts Views on Vision4Press platform.
Data correspond to usage on the plateform after 2015. The current usage metrics is available 48-96 hours after online publication and is updated daily on week days.
Initial download of the metrics may take a while.