Fig. 15
Download original image
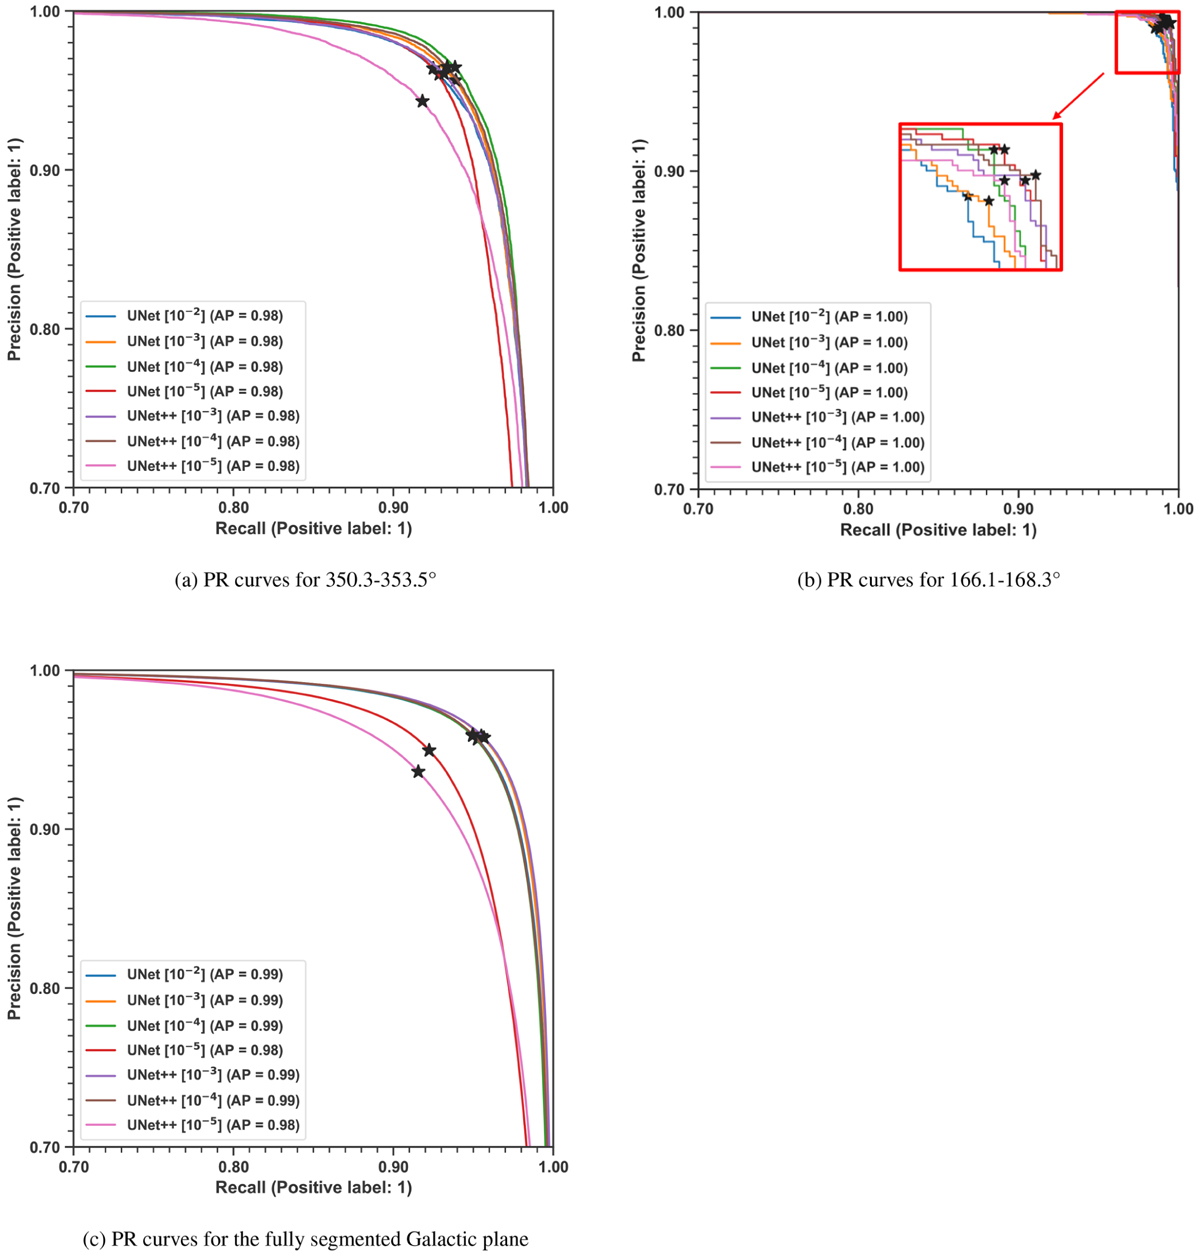
P–R curves of the schemes reported in Fig. 14, computed on the segmented removed zones (top) and the full Galactic plane (bottom). (a) P–R curves computed on the segmented 350.3–353.5°, which corresponds to the dense region that was removed from the patches data set. (b) P–R curves computed on the segmented 166.1–168.3°, which corresponds to the sparse region that we removed from the patches data set. (c) P–R curves computed on the full segmented Galactic plane. Unlike in Fig. 15b, P–R curves obtained on the latter are close to those obtained in Fig. 15a.
Current usage metrics show cumulative count of Article Views (full-text article views including HTML views, PDF and ePub downloads, according to the available data) and Abstracts Views on Vision4Press platform.
Data correspond to usage on the plateform after 2015. The current usage metrics is available 48-96 hours after online publication and is updated daily on week days.
Initial download of the metrics may take a while.