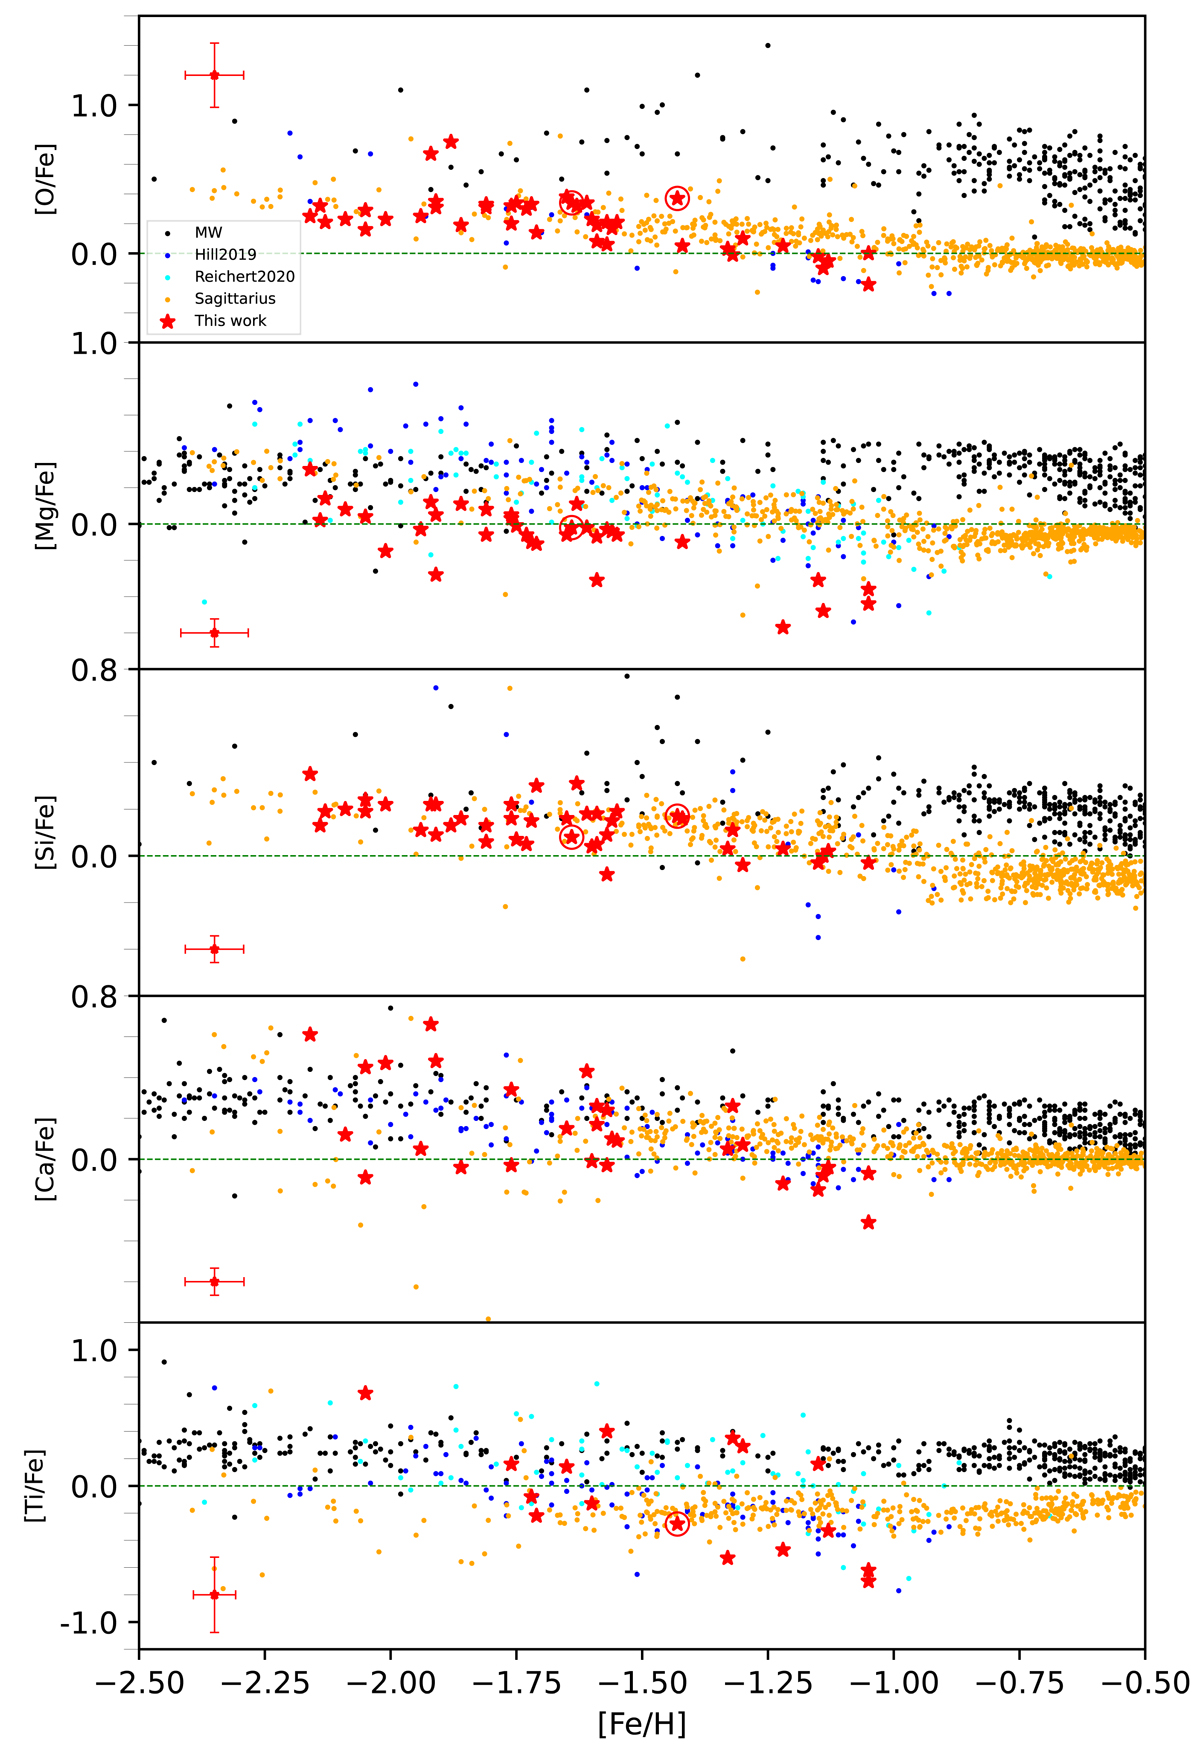
Fig. 3.
Download original image
[α/Fe] vs. [Fe/H]. Scl stars from this work are labeled as red stars. The error bar in each panel indicates the median uncertainty of available measurements. Possible AGB stars are outlined with large circles. Black dots correspond to MW stars from the halo (92 out of 168 stars from Fulbright 2000, 35 stars from Cayrel et al. 2004, 234 out of 253 stars from Barklem et al. 2005, 131 out of 199 stars from Yong et al. 2013, 287 out of 313 stars from Roederer et al. 2014), and MW stars from the disc (174 out of 181 stars from Reddy et al. 2003, 153 out of 176 stars from Reddy et al. 2006, 679 out of 714 stars from Bensby et al. 2014). Blue and cyan dots represent Scl stars from H19 and R20, respectively. Orange dots represent Sgr stars from Hasselquist et al. (2021).
Current usage metrics show cumulative count of Article Views (full-text article views including HTML views, PDF and ePub downloads, according to the available data) and Abstracts Views on Vision4Press platform.
Data correspond to usage on the plateform after 2015. The current usage metrics is available 48-96 hours after online publication and is updated daily on week days.
Initial download of the metrics may take a while.