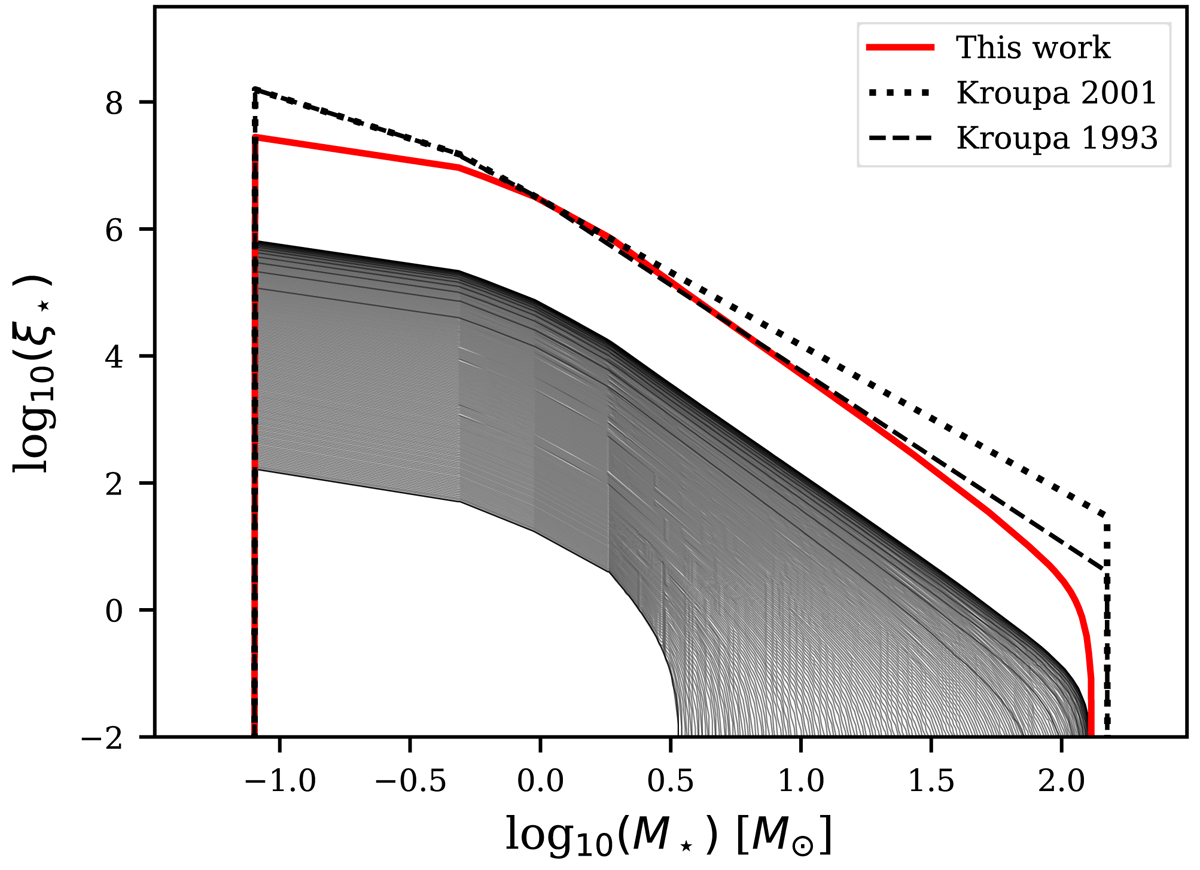
Fig. A.2.
Download original image
Time-integrated galaxy-wide IMF for all stars ever formed (thick solid red curve) and the galaxy-wide IMF for each 10 Myr star formation time step (thin solid curves) normalized by the total mass of a stellar population. Our best-fit IMF is compared with the canonical Kroupa (2001) IMF with α3 = 2.3 (dotted line) and the solar-neighborhood IMF from Kroupa et al. (1993) with α3 = 2.7 (dashed line).
Current usage metrics show cumulative count of Article Views (full-text article views including HTML views, PDF and ePub downloads, according to the available data) and Abstracts Views on Vision4Press platform.
Data correspond to usage on the plateform after 2015. The current usage metrics is available 48-96 hours after online publication and is updated daily on week days.
Initial download of the metrics may take a while.