Open Access
Fig. A.1.
Download original image
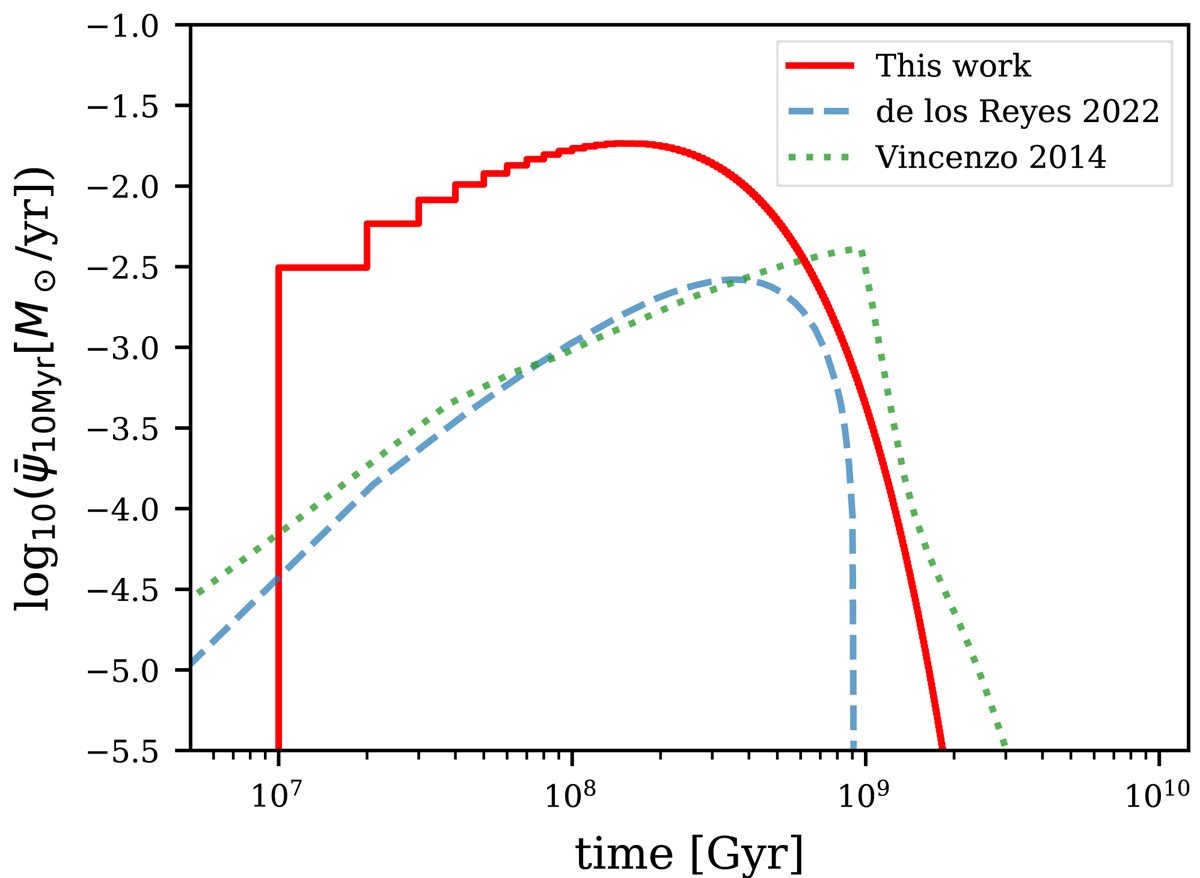
Star formation history of our best-fit model (red curve), formulated by the delayed-τ model (Eq. A.1). The green dotted and blue dashed curves denote the star formation history applied in Vincenzo et al. (2014) and de los Reyes et al. (2022, their fiducial model), respectively.
Current usage metrics show cumulative count of Article Views (full-text article views including HTML views, PDF and ePub downloads, according to the available data) and Abstracts Views on Vision4Press platform.
Data correspond to usage on the plateform after 2015. The current usage metrics is available 48-96 hours after online publication and is updated daily on week days.
Initial download of the metrics may take a while.