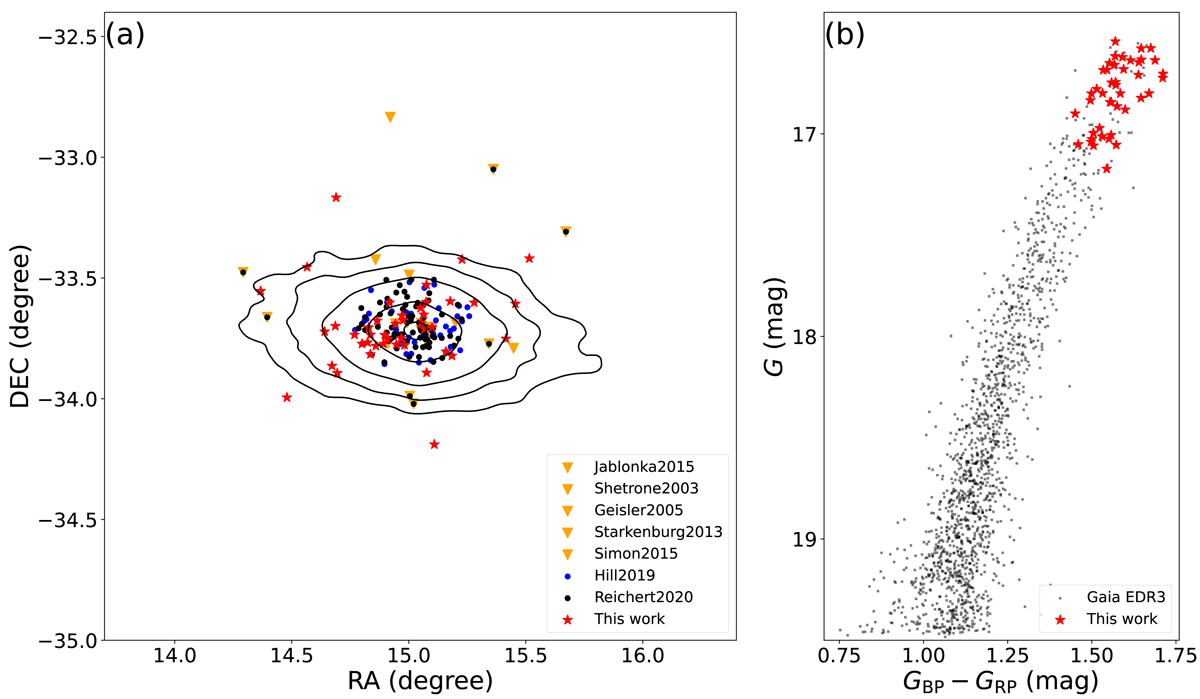
Fig. 1.
Download original image
Target information. (a): Spatial distribution of observed Scl stars from the literature. Scl stars from this work are colored red. Blue dots represent stars from H19. Black dots represent stars from R20. Golden triangles show stars from Jablonka et al. (2015), Shetrone et al. (2003), Geisler et al. (2005), Starkenburg et al. (2013), and Simon et al. (2015). An isodensity contour map represented by black lines is plotted based on Table 5 from Muñoz et al. (2018a). (b): Color–magnitude diagram of Scl based on Gaia (gray dots).
Current usage metrics show cumulative count of Article Views (full-text article views including HTML views, PDF and ePub downloads, according to the available data) and Abstracts Views on Vision4Press platform.
Data correspond to usage on the plateform after 2015. The current usage metrics is available 48-96 hours after online publication and is updated daily on week days.
Initial download of the metrics may take a while.