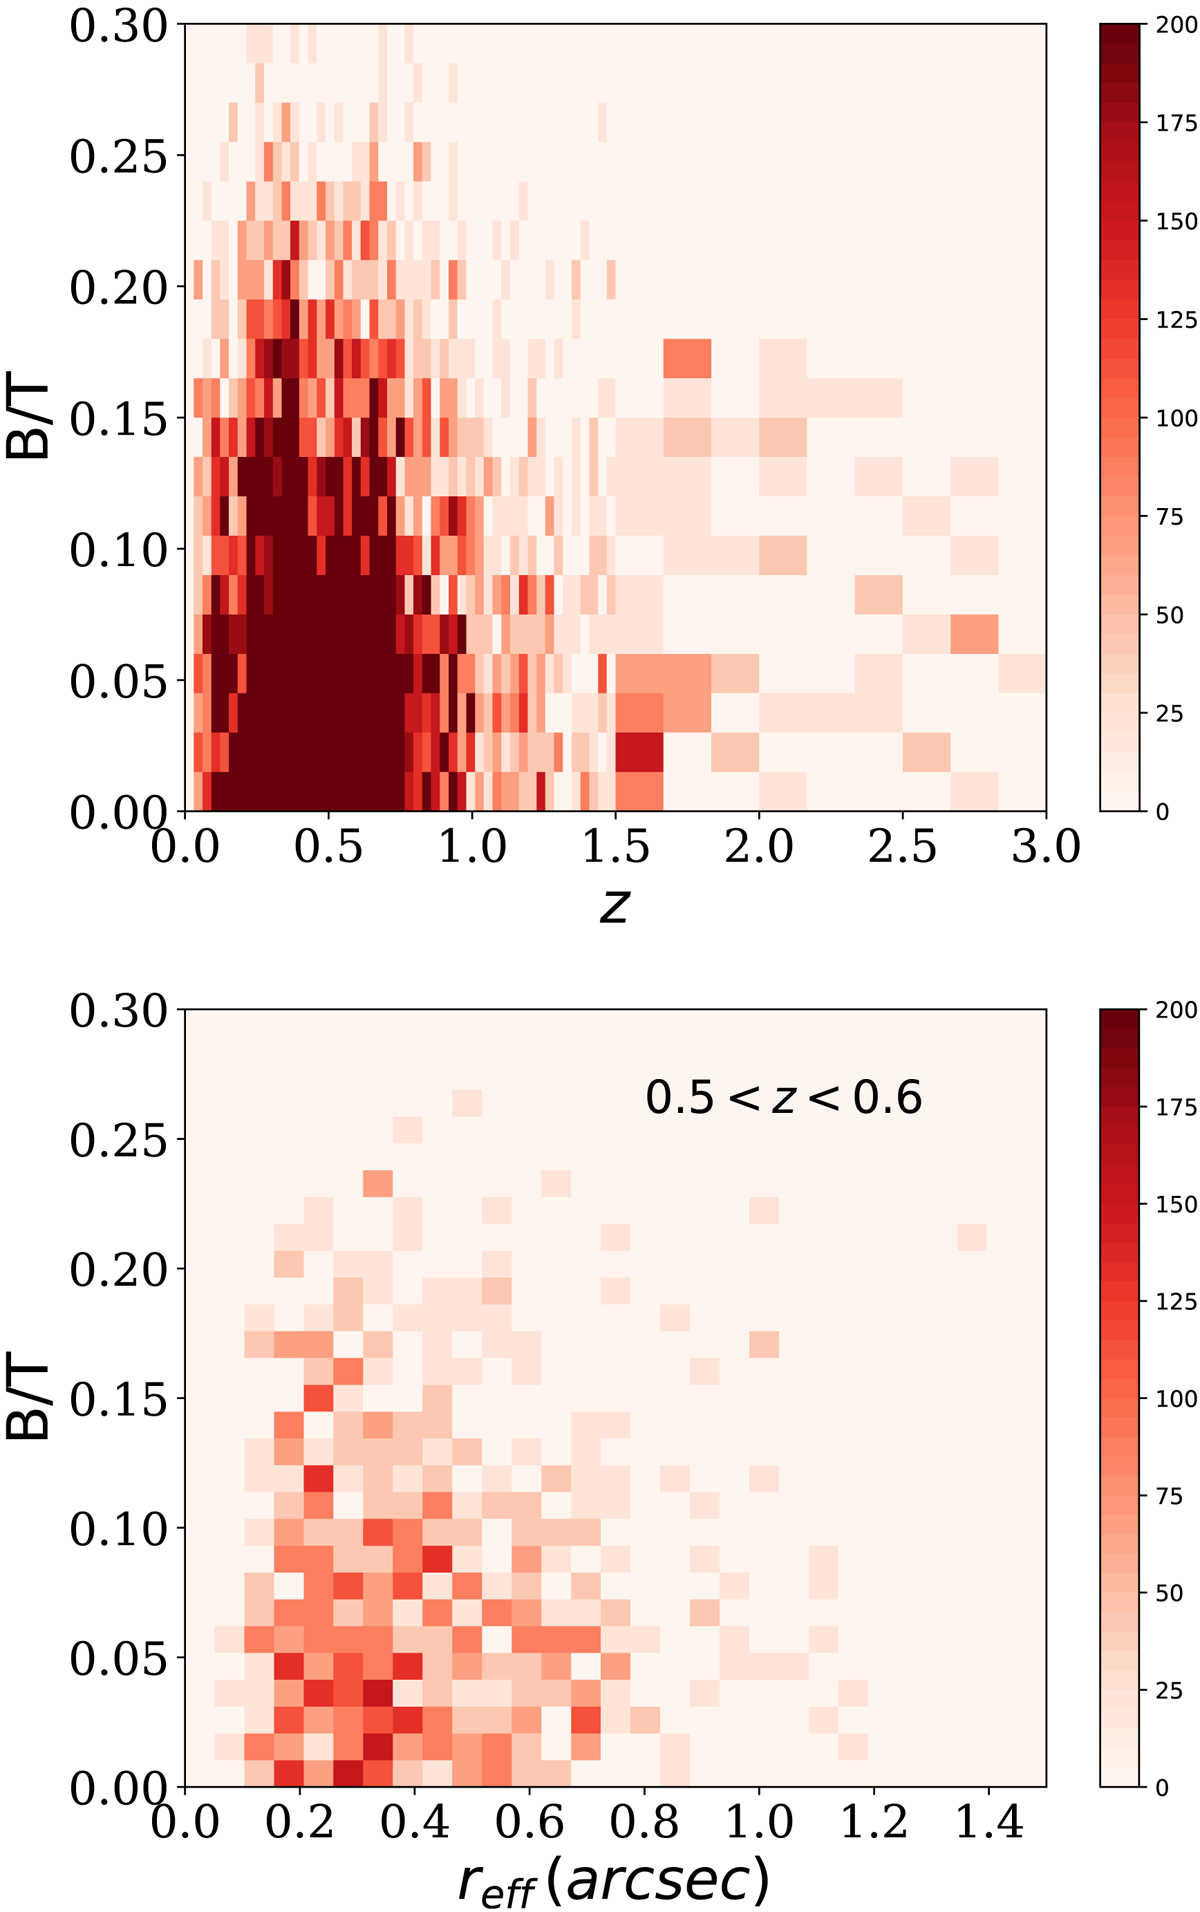
Fig. 19.
Download original image
Number distribution of galaxies with S/N > 50 in 2D grids of B/T vs. redshift z (top panel) and of B/T vs. the intrinsic size σ (bottom panel), expected from the full 400 deg2 of CSST deep survey. The color bar represents the number of galaxies in unit of 50 and truncated at 200 for clear visibility. In the top panel, the bin size of B/T is 0.015, and that for z is 0.03 for redshifts within the range of [0, 1.5] and 0.15 within (1.5, 3]. In the bottom panel, the galaxies are selected with redshifts within [0.5, 0.6].
Current usage metrics show cumulative count of Article Views (full-text article views including HTML views, PDF and ePub downloads, according to the available data) and Abstracts Views on Vision4Press platform.
Data correspond to usage on the plateform after 2015. The current usage metrics is available 48-96 hours after online publication and is updated daily on week days.
Initial download of the metrics may take a while.