Fig. 13.
Download original image
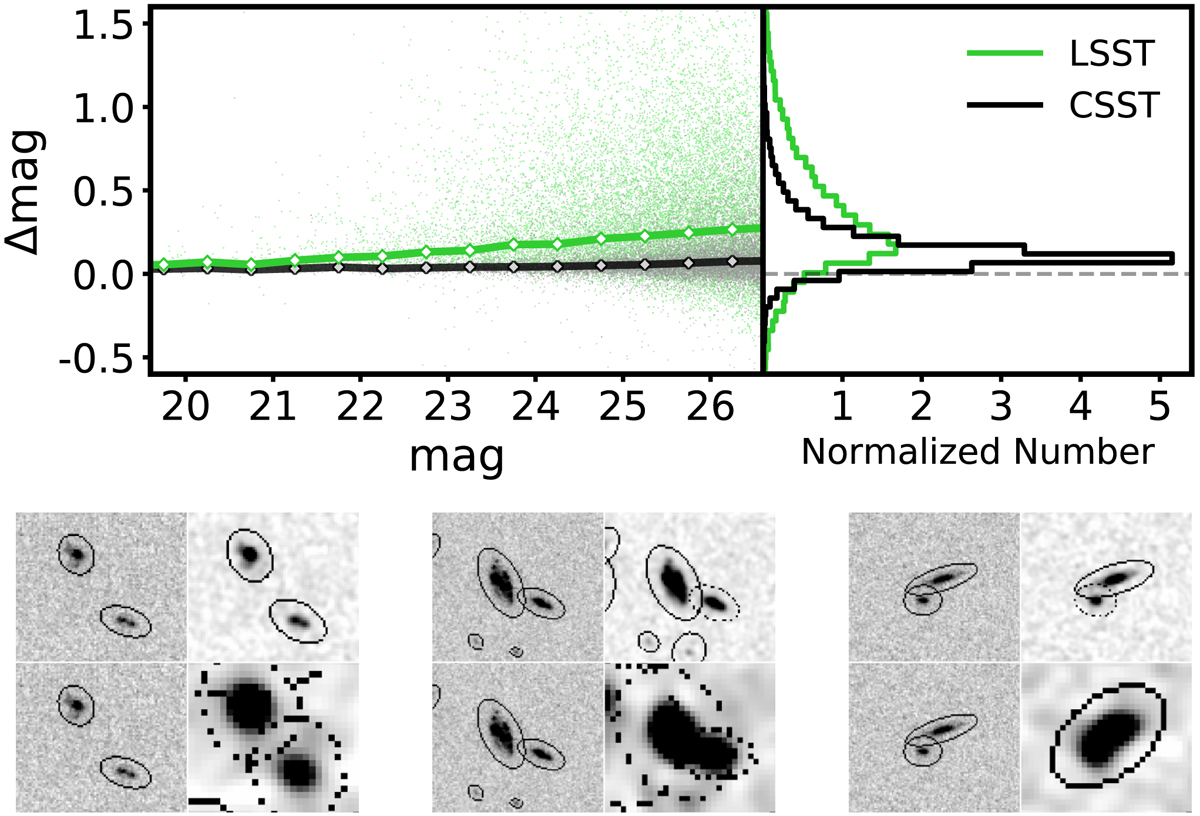
Difference of the MAG_AUTO measurements from the I0 and I1 images, ![]() vs.
vs. ![]() . Top left: Δmag as a function of the I0 magnitude for the LSST-like and CSST simulations. The lines show the median of Δmag. Top right: distribution of Δmag. Bottom: three examples of galaxy images illustrating the impact of blending with the top for CSST I0 (left) and I1 (right), and the bottom for the corresponding LSST-like case. The SExtractor Kron ellipses are overlaid for the detected objects.
. Top left: Δmag as a function of the I0 magnitude for the LSST-like and CSST simulations. The lines show the median of Δmag. Top right: distribution of Δmag. Bottom: three examples of galaxy images illustrating the impact of blending with the top for CSST I0 (left) and I1 (right), and the bottom for the corresponding LSST-like case. The SExtractor Kron ellipses are overlaid for the detected objects.
Current usage metrics show cumulative count of Article Views (full-text article views including HTML views, PDF and ePub downloads, according to the available data) and Abstracts Views on Vision4Press platform.
Data correspond to usage on the plateform after 2015. The current usage metrics is available 48-96 hours after online publication and is updated daily on week days.
Initial download of the metrics may take a while.