Fig. 1.
Download original image
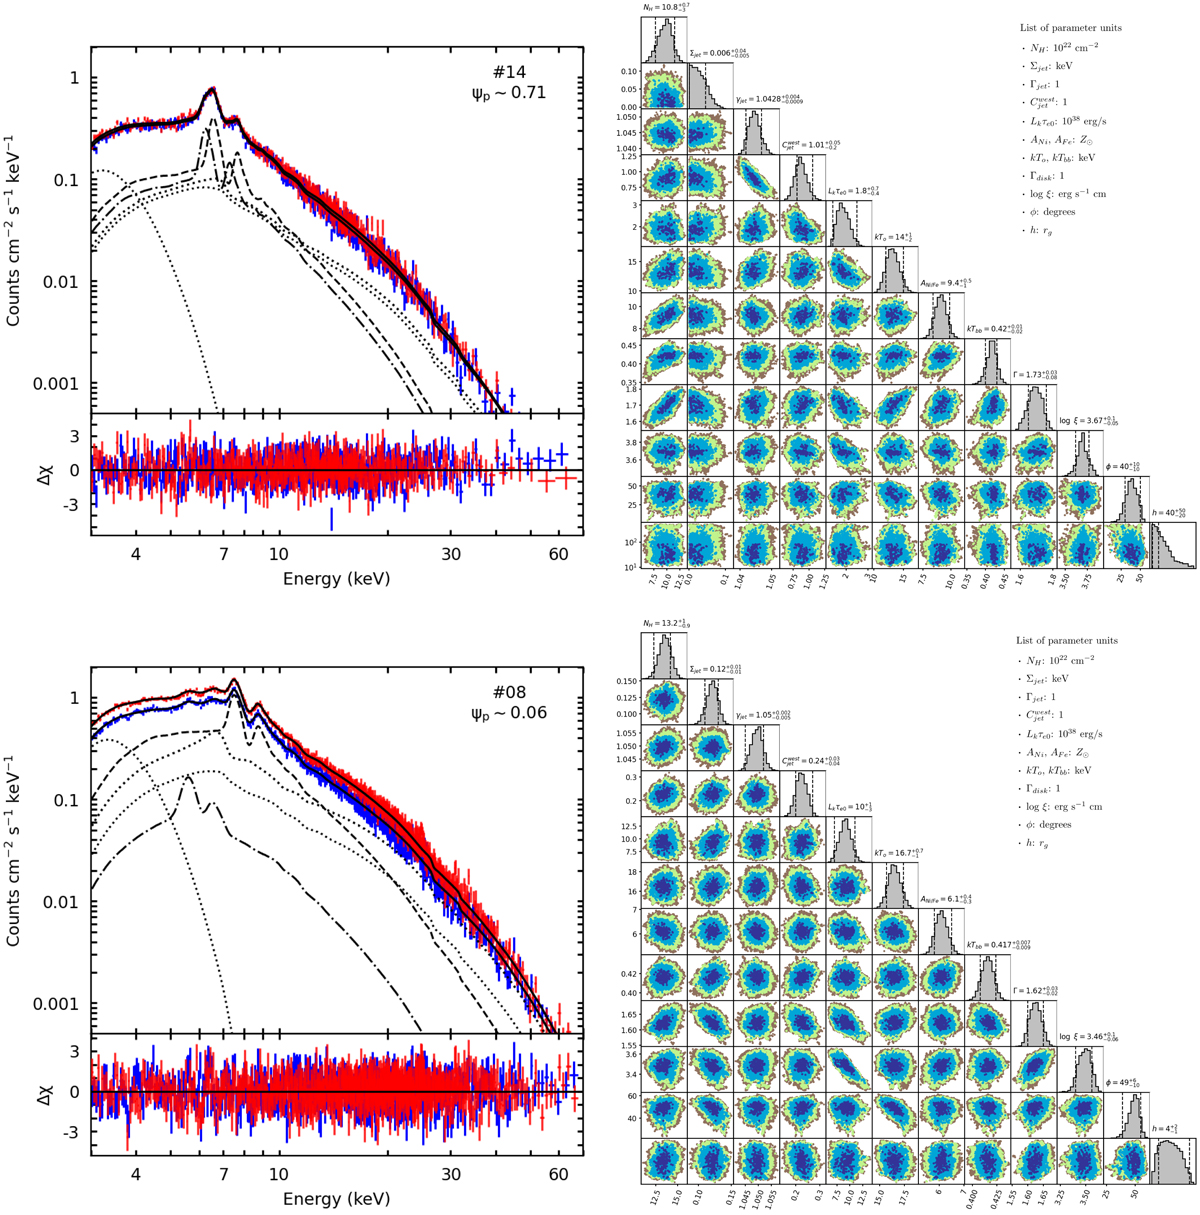
Spectral behaviour of SS433 on two distinct precessional phases. Left column: sample of NuSTAR FPMA/B averaged spectra fitted with a combination of bjet, diskbb, xillverCp, and relxilllpCp. The dashed line corresponds to the eastern jet model component. The dot-dashed line corresponds to the western jet model component. Dotted lines correspond to the different disk model components. Right column: one- and two-dimensional distribution of some continuum model parameters derived from the MCMC simulations. The outward colour gradient indicates the following confidence levels: 90%, 99%, 99.9%, and 99.99%. See Table A.1 for details on parameters units.
Current usage metrics show cumulative count of Article Views (full-text article views including HTML views, PDF and ePub downloads, according to the available data) and Abstracts Views on Vision4Press platform.
Data correspond to usage on the plateform after 2015. The current usage metrics is available 48-96 hours after online publication and is updated daily on week days.
Initial download of the metrics may take a while.