Fig. 8
Download original image
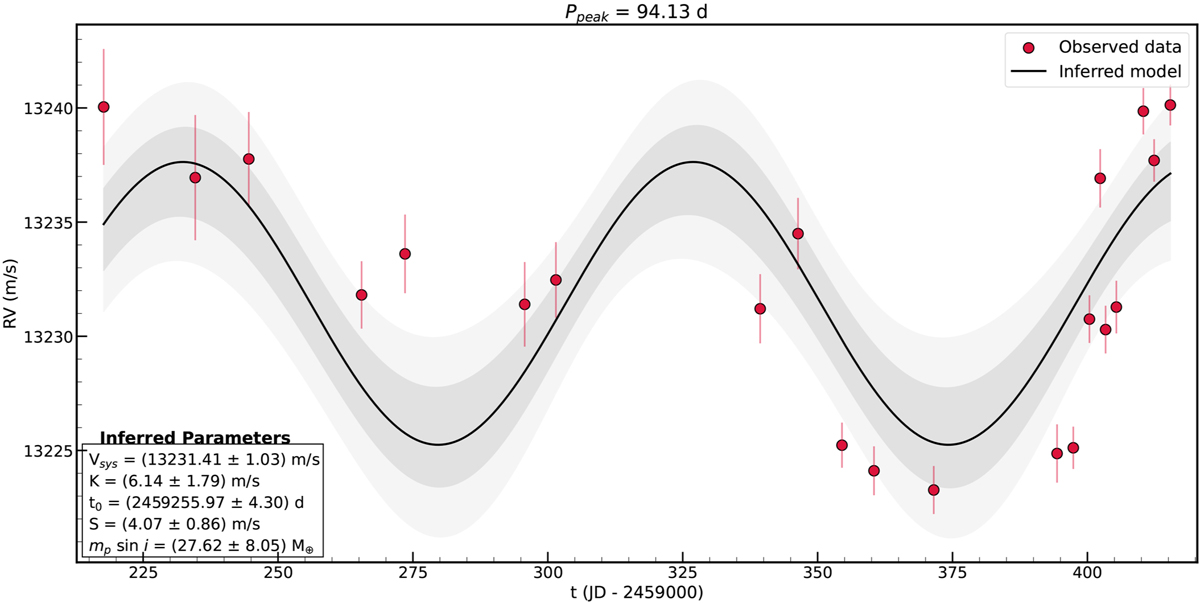
RV observed data (red dots) vs. time. The inferred model is shown as a solid line, using as prior Ppeak = 94.13 d. The parameters resulting from the MCMC inference, as well as the corresponding mass lower limit, are collected in the bottom left box. The shaded region shows the confidence interval at 1σ (dark gray) and 2σ (light gray) for the hypothesis with a planet.
Current usage metrics show cumulative count of Article Views (full-text article views including HTML views, PDF and ePub downloads, according to the available data) and Abstracts Views on Vision4Press platform.
Data correspond to usage on the plateform after 2015. The current usage metrics is available 48-96 hours after online publication and is updated daily on week days.
Initial download of the metrics may take a while.