Open Access
Fig. 6
Download original image
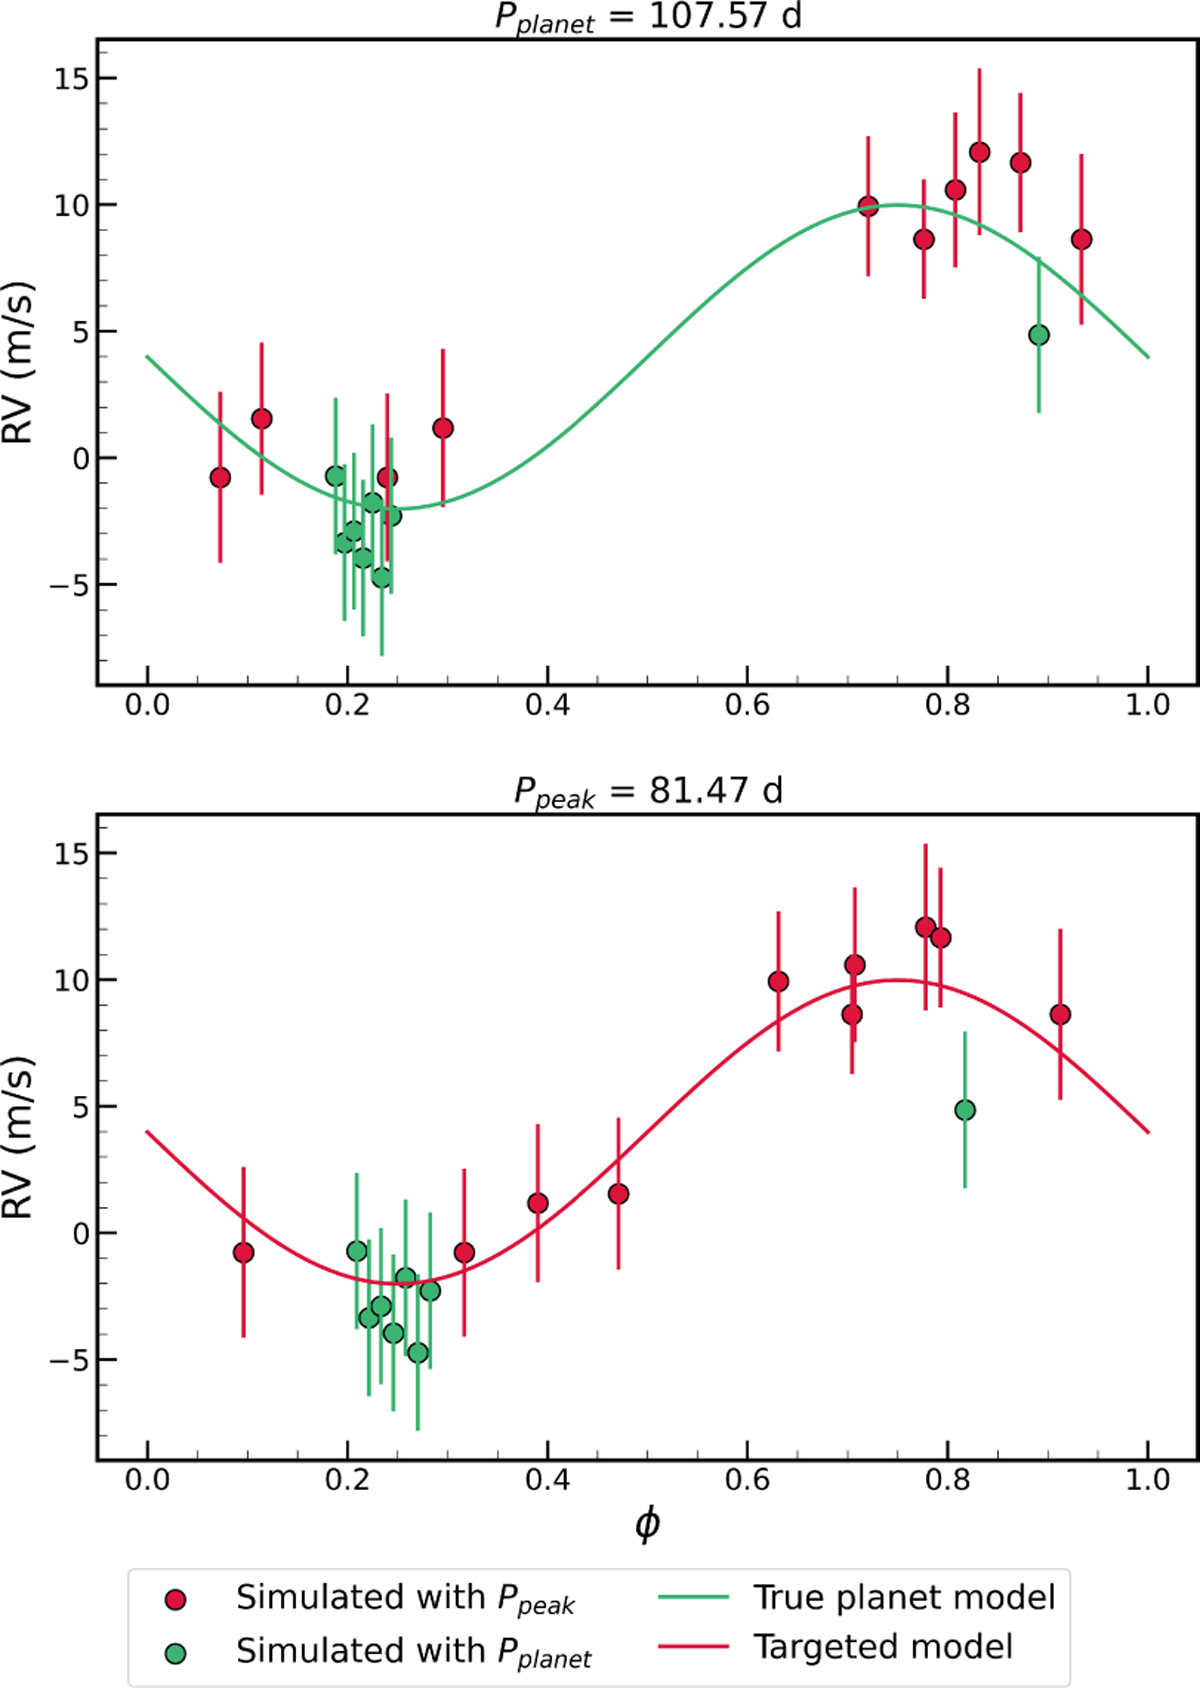
Phase-folded RV curve of simulated data. Top: Assuming the true orbital period (Pplanet). In red are indicated the first observations, generated with Ppeak constrained to be compatible with the true signal within 1σ. Bottom: Assuming the incorrect period, the one used to perform KOBEsim, Ppeak.
Current usage metrics show cumulative count of Article Views (full-text article views including HTML views, PDF and ePub downloads, according to the available data) and Abstracts Views on Vision4Press platform.
Data correspond to usage on the plateform after 2015. The current usage metrics is available 48-96 hours after online publication and is updated daily on week days.
Initial download of the metrics may take a while.