Fig. 5
Download original image
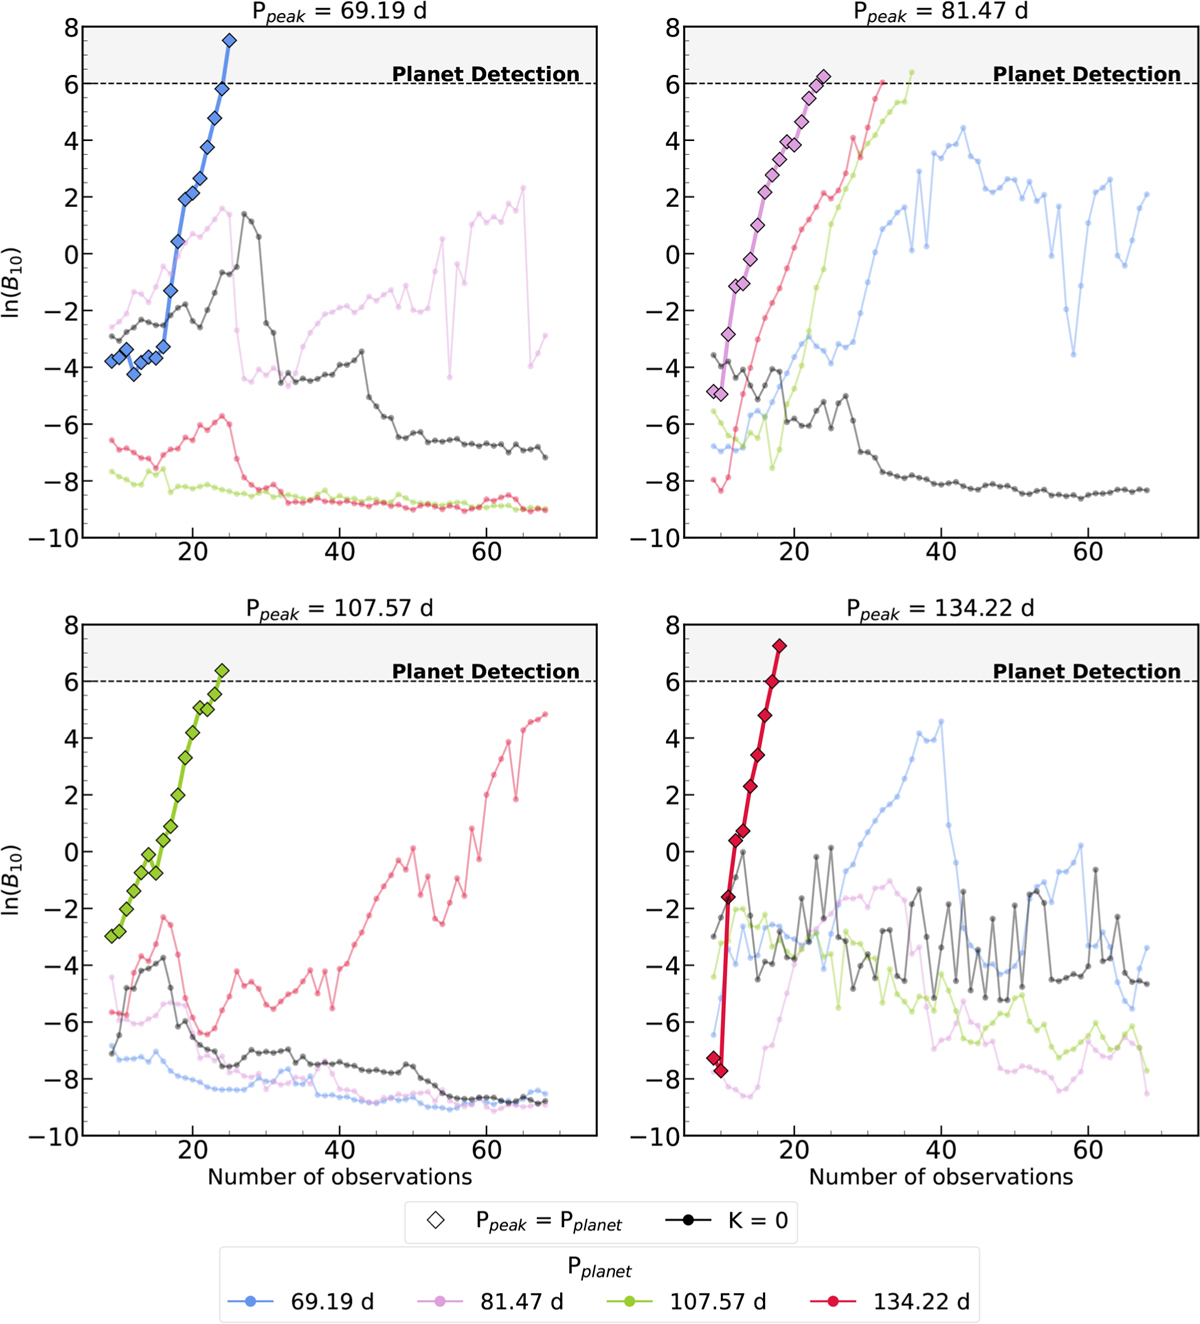
Prediction in the evolution of the logarithm of the Bayes factor when targeting with KOBEsim a period Ppeak (each chart), but the signal is induced by a planet at Pplanet (see legend for colors). All the cases induce a signal of semi-amplitude K = 6 m s−1. The solid lines are the cases in which KOBEsim is pursuing the correct period (Ppeak = Pplanet). The black line corresponds to the active-star case. After the first ten observations it is assumed that the signal is turned off (K = 0).
Current usage metrics show cumulative count of Article Views (full-text article views including HTML views, PDF and ePub downloads, according to the available data) and Abstracts Views on Vision4Press platform.
Data correspond to usage on the plateform after 2015. The current usage metrics is available 48-96 hours after online publication and is updated daily on week days.
Initial download of the metrics may take a while.