Fig. 2
Download original image
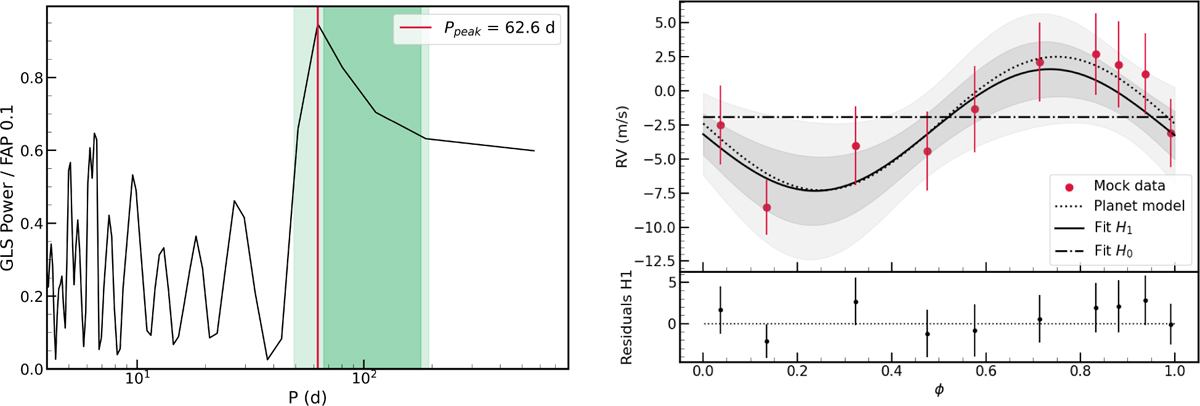
Simulation of ten RV datapoints to test KOBEsim. Left: GLS periodogram showing an emerging period at Ppeak = 62.6 d nearly reaching a false alarm probability (FAP) of 0.1 (y-axis equal to 1). The lighter green region corresponds to the optimistic HZ, the darker region to the conservative HZ as defined in Kopparapu et al. (2014). Right: Fit of the simulated RV data. The solid black line is the fit for one-planet hypothesis (H1); the dash-dotted line is fit for the null hypothesis (H0); and the dotted line is the true model used to simulate the datapoints (in red). The shaded region shows the confidence interval at 1σ (dark gray) and 2σ (light gray) for the hypothesis with a planet. The lower panel shows the residuals for the one-planet hypothesis fit.
Current usage metrics show cumulative count of Article Views (full-text article views including HTML views, PDF and ePub downloads, according to the available data) and Abstracts Views on Vision4Press platform.
Data correspond to usage on the plateform after 2015. The current usage metrics is available 48-96 hours after online publication and is updated daily on week days.
Initial download of the metrics may take a while.