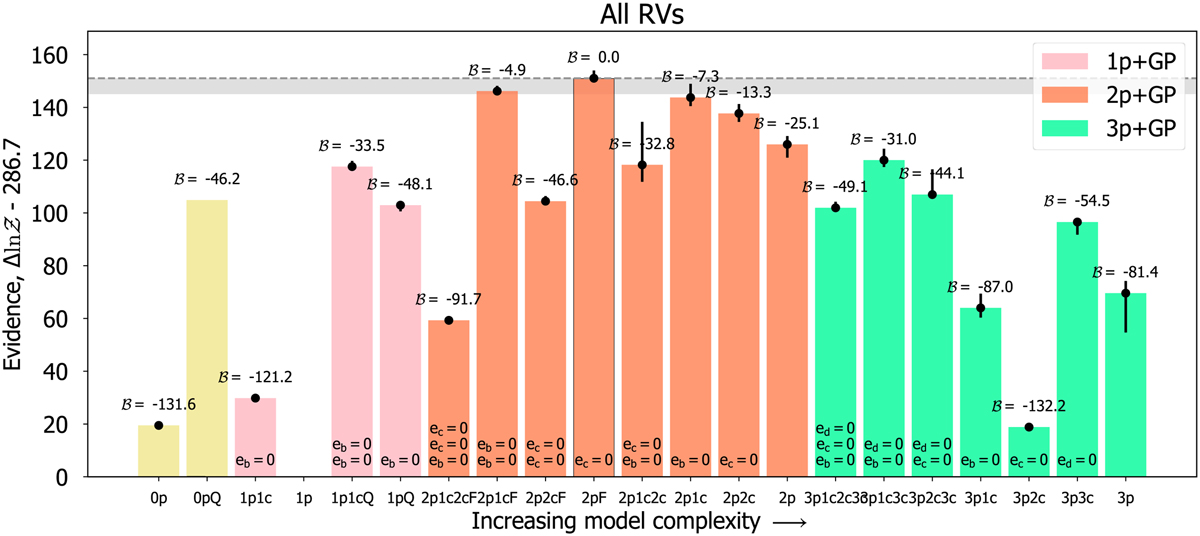
Fig. 8
Download original image
Comparison of the logarithm of the Bayesian evidence (ℬ = In 𝒵) for the different tested models (labeled in the X axis) in the case of the RV-only analysis (Sect. 4.2). The labels for the models correspond to Xp[Pic][Z], where X is the number of planets assumed in the system, Pic are the identifiers of the planets with assumed circular orbits, and Z indicates whether we are using a flat (F) slope (i.e., assuming slope = 0) or a quadratic (Q) trend. The gray-shaded region displays the region of Δ𝒵 = −6 from the larger evidence model showing its strength against simpler models.
Current usage metrics show cumulative count of Article Views (full-text article views including HTML views, PDF and ePub downloads, according to the available data) and Abstracts Views on Vision4Press platform.
Data correspond to usage on the plateform after 2015. The current usage metrics is available 48-96 hours after online publication and is updated daily on week days.
Initial download of the metrics may take a while.