Fig. 1
Download original image
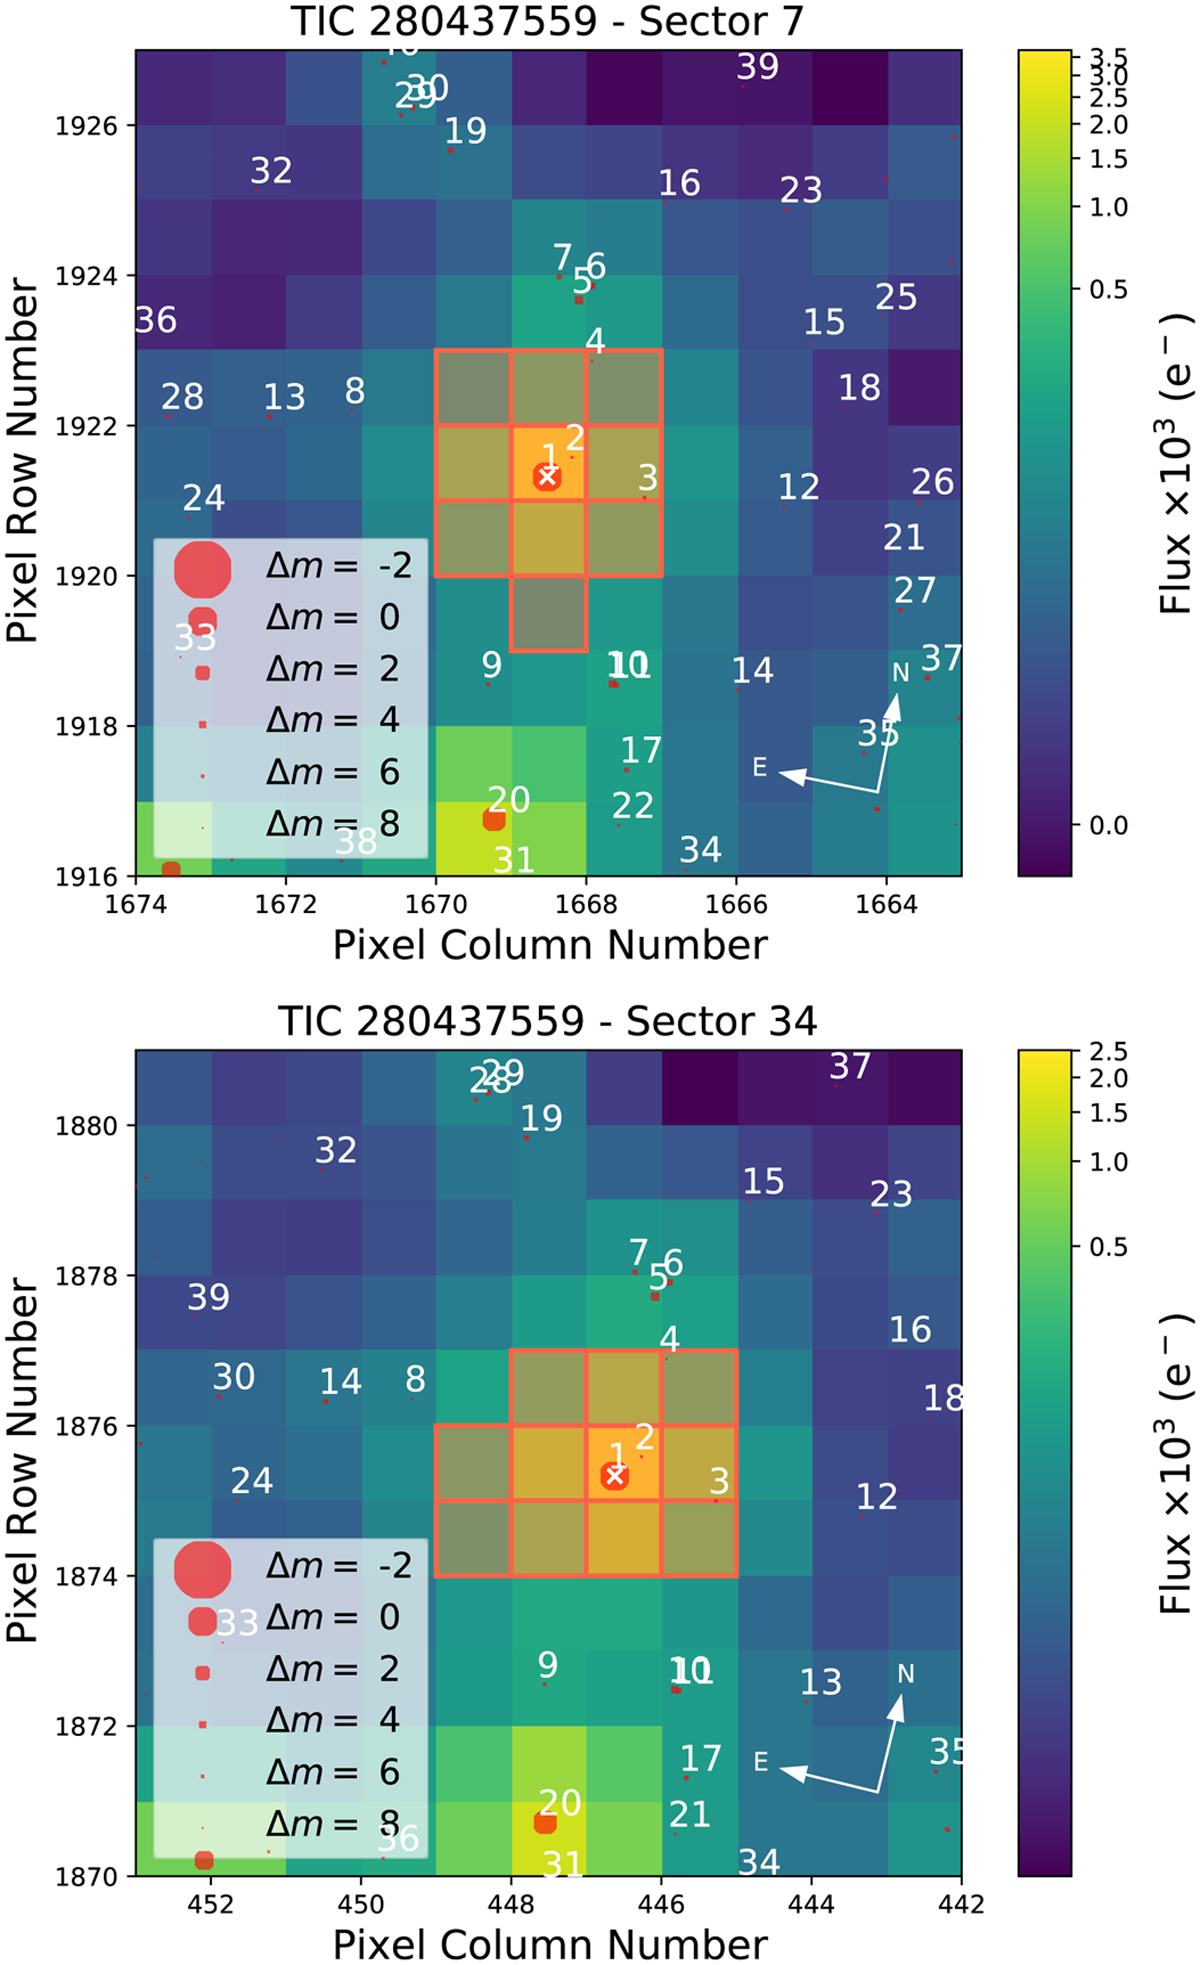
Target pixel file corresponding to TOI-969 observations by the TESS mission in sectors 7 (upper panel) and 34 (lower panel). In both panels, the sources from Gaia DR3 are shown as red circles, with their size corresponding to the magnitude contrast against TOI-969 (marked with the label “1” and a white cross). The aperture used by the TESS-SPOC pipeline is shown as a shaded red region in each panel. The figures are computed using the tpfplotter algorithm by Aller et al. (2020).
Current usage metrics show cumulative count of Article Views (full-text article views including HTML views, PDF and ePub downloads, according to the available data) and Abstracts Views on Vision4Press platform.
Data correspond to usage on the plateform after 2015. The current usage metrics is available 48-96 hours after online publication and is updated daily on week days.
Initial download of the metrics may take a while.